DOWNLOAD THE FULL REPORT
The recreational demands of the 21st century are bringing new challenges for public land management. This PERC Public Lands Report examines some of the primary sources of funding for outdoor recreation-related opportunities on public lands, aiming to be informative rather than claiming to be exhaustive or comprehensive. It demonstrates that by many measures, inflation-adjusted recreation-related funding is stagnant or declining despite increased attention on and demand for outdoor recreation.
As public lands that provide outdoor recreation opportunities grow in importance, it’s worthwhile to examine how we fund and maintain those lands. Adequate funding will not in and of itself guarantee responsible stewardship of our public recreation lands. But recent trends suggest that many sources of recreation funds have either stagnated or declined in real terms, even as visitation has been increasing over the long term. An assessment of recreation-related funding sources and their trends can provide insights about different funding strategies and, ideally, help inform and improve the future of recreation on public lands.
Introduction
Outdoor recreation is on the rise. Nearly half of all Americans recreate outdoors, and the sector is becoming more important on various fronts, whether socially, economically, or politically. A recent assessment by the Bureau of Economic Analysis found that outdoor recreation accounted for $412 billion of GDP in 2016—or 2.2 percent of the entire U.S. economy.[1] The bureau estimated that the sector has grown faster than the overall national economy in three of the four years that it has analyzed.[2]
The participation rate in outdoor recreation has been consistent over the past decade. The Outdoor Foundation reports that 49 percent of Americans ages 6 and up participated in an outdoor recreation activity in 2017.[3] Given population growth, the absolute number of Americans recreating outdoors has been on the rise, increasing from about 136 million participants a decade ago to 146 million in 2017. Some of the most popular activities today include running, fishing, cycling, hiking, and camping. In all, Americans go on nearly 11 billion recreation outings each year.
Public lands are the backdrop for much of that recreation. The Outdoor Industry Association calls public lands and waterways “the backbone of our outdoor recreation economy.”[4] From national forests and wildlife refuges to national parks and wild and scenic rivers, some of the most prized landscapes and destinations in the country are found on public lands. National and state parks combined to host more than 1 billion visits last year. And local ball fields, recreation facilities, and public parks provide numerous weekend and after-school recreation opportunities across the nation.
The recreational demands of the 21st century are bringing new challenges for public land management. This PERC Public Lands Report examines some of the primary sources of funding for outdoor recreation-related opportunities on public lands, aiming to be informative rather than claiming to be exhaustive or comprehensive.[5] It demonstrates that by many measures, inflation-adjusted recreation-related funding is stagnant or declining despite increased attention on and demand for outdoor recreation.
While the focus of this Public Lands Report is recreation funding, much public spending on the broader category of natural resources benefits and enhances the provision of recreational amenities. For instance, spending to improve wildlife habitat could be justified by and aimed at achieving certain conservation outcomes, yet such spending could result in more and better wildlife for sportsmen and other recreationists to enjoy. This report, therefore, examines sources of funding that relate to recreation generally, including some that support habitat restoration, wildlife management, and other conservation aims that are linked to recreation.
As public lands that provide outdoor recreation opportunities grow in importance, it’s worthwhile to examine the way that we fund and maintain those lands. An assessment of those funding sources and their recent trends can provide insights about different funding strategies and, ideally, help inform and improve the future of recreation on public lands.
Spending on Natural Resources, Environment, and Recreation
The Office of Management and Budget’s breakdown of the federal budget into functions and subfunctions provides a snapshot of all federal spending. Function 300 concerns all programs relating to natural resources and the environment, which includes spending on environmental protection and enhancement, recreation and wildlife areas, and the development and management of land, water, and mineral resources owned by the U.S. government.[6]
In real terms, spending under Function 300 has more than doubled since 1962, albeit with periods of volatility. Spending under the budget function was approximately $13 billion in 1962 in real terms and had risen to $40 billion by 2018.
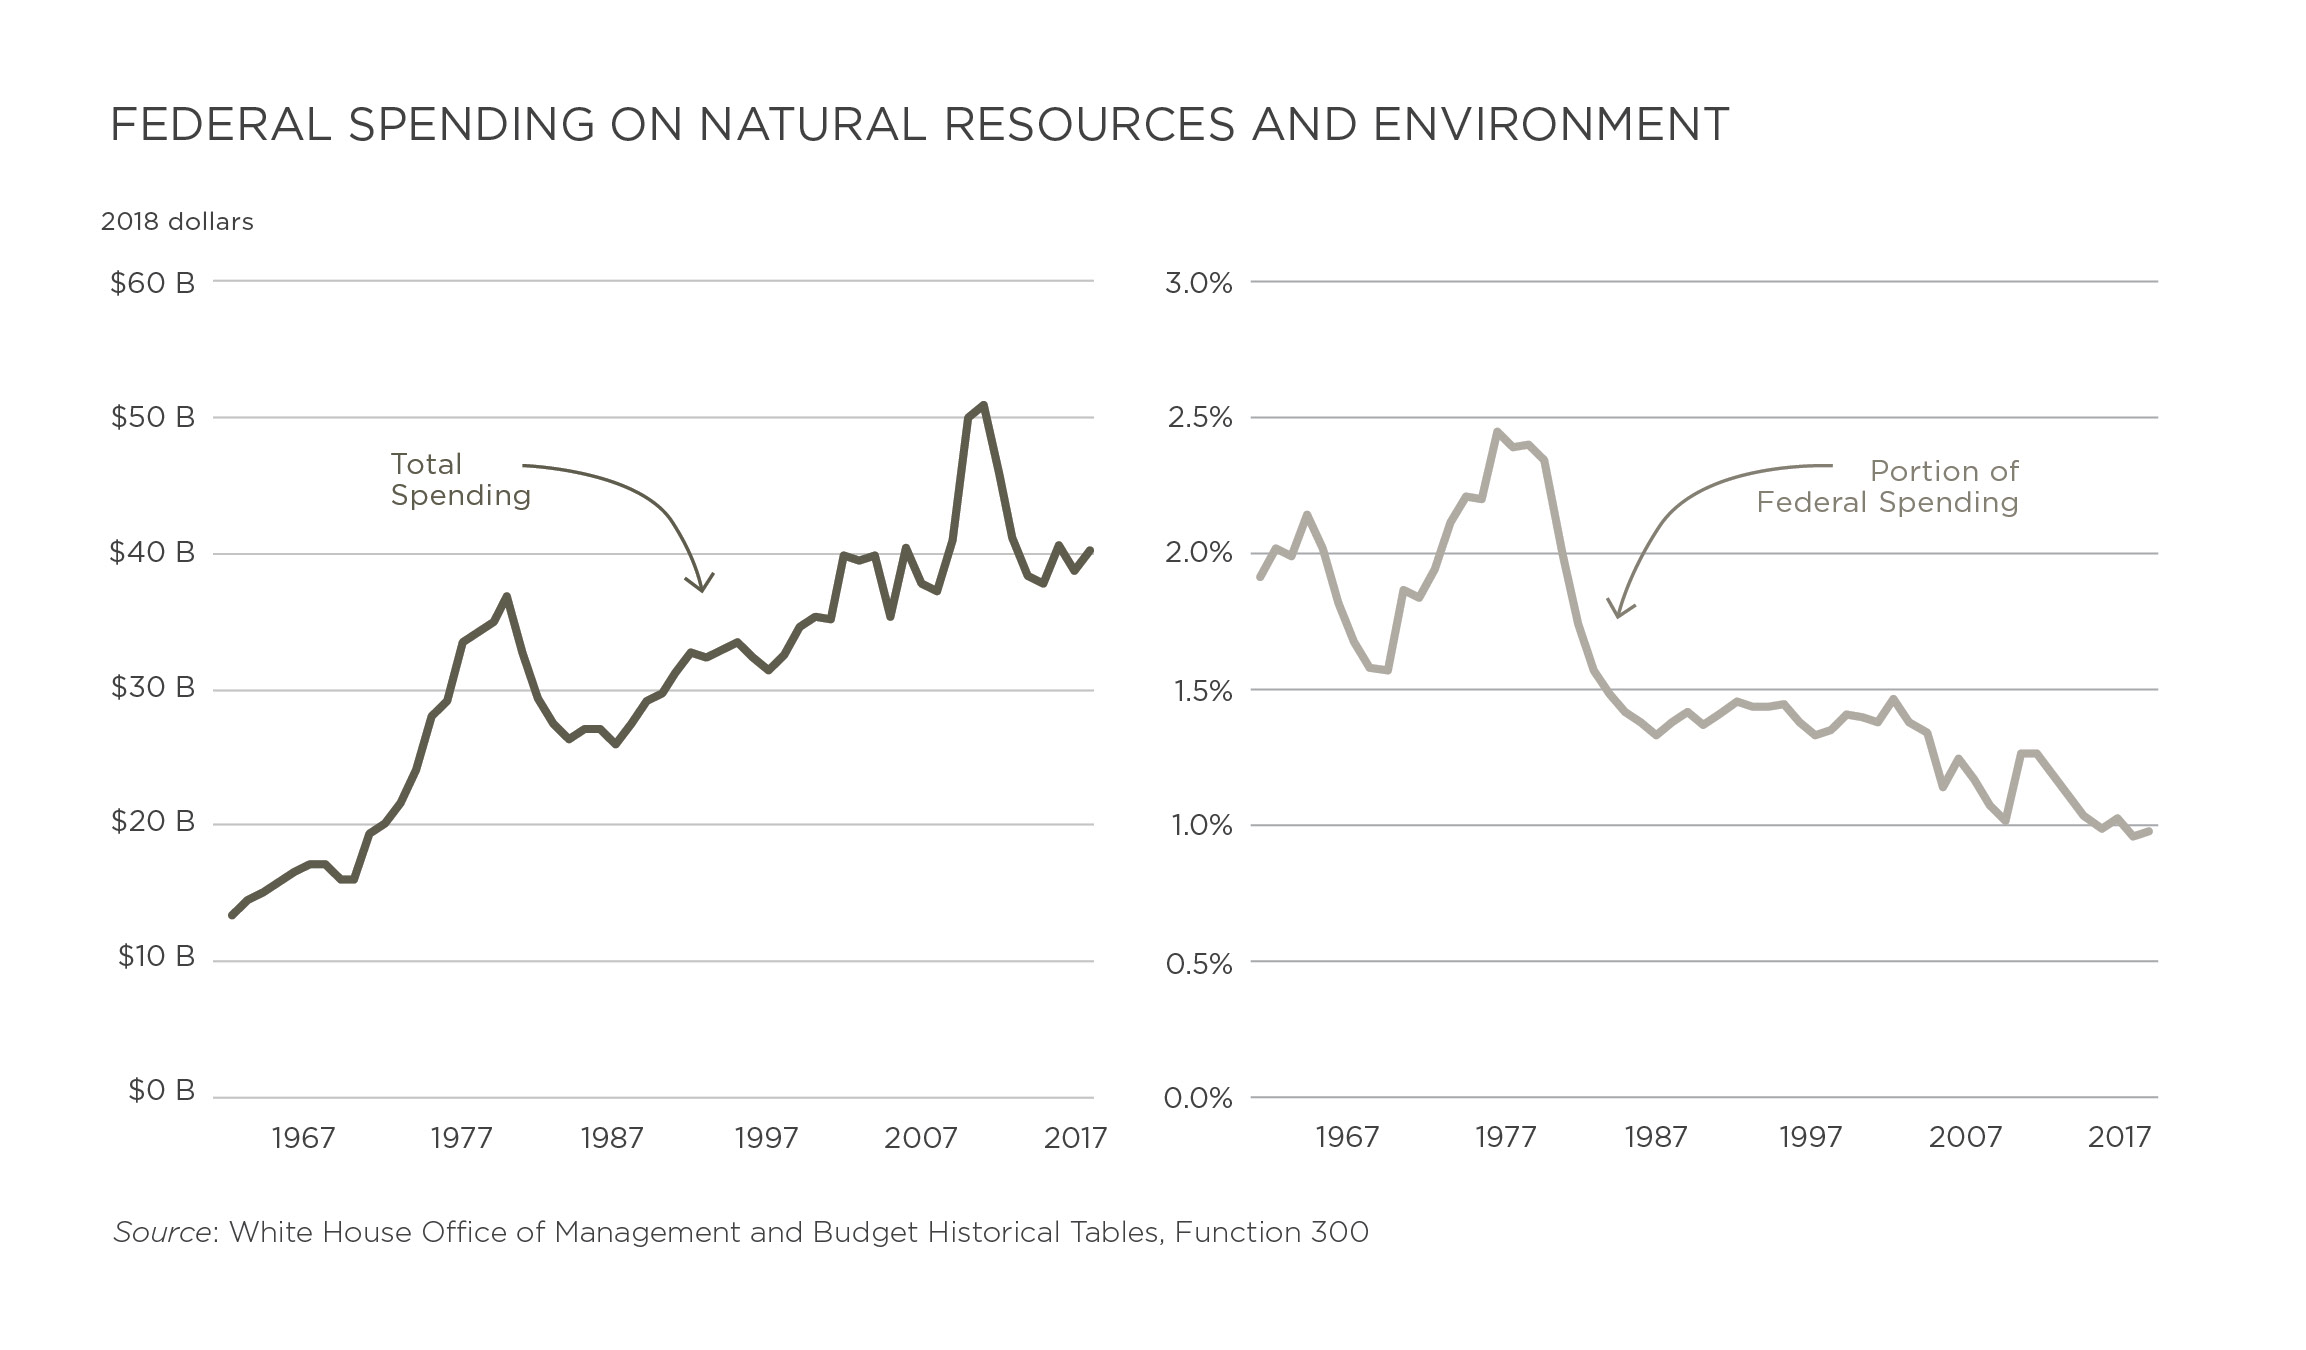
Over time, however, that spending has represented a smaller and smaller share of total federal spending. Throughout much of the 1960s and 1970s, when the overall federal budget was significantly smaller than it is today, Function 300 accounted for roughly 2 percent of all federal spending. Today, the function accounts for less than 1 percent of all federal outlays—about $40 billion of a $4 trillion budget.
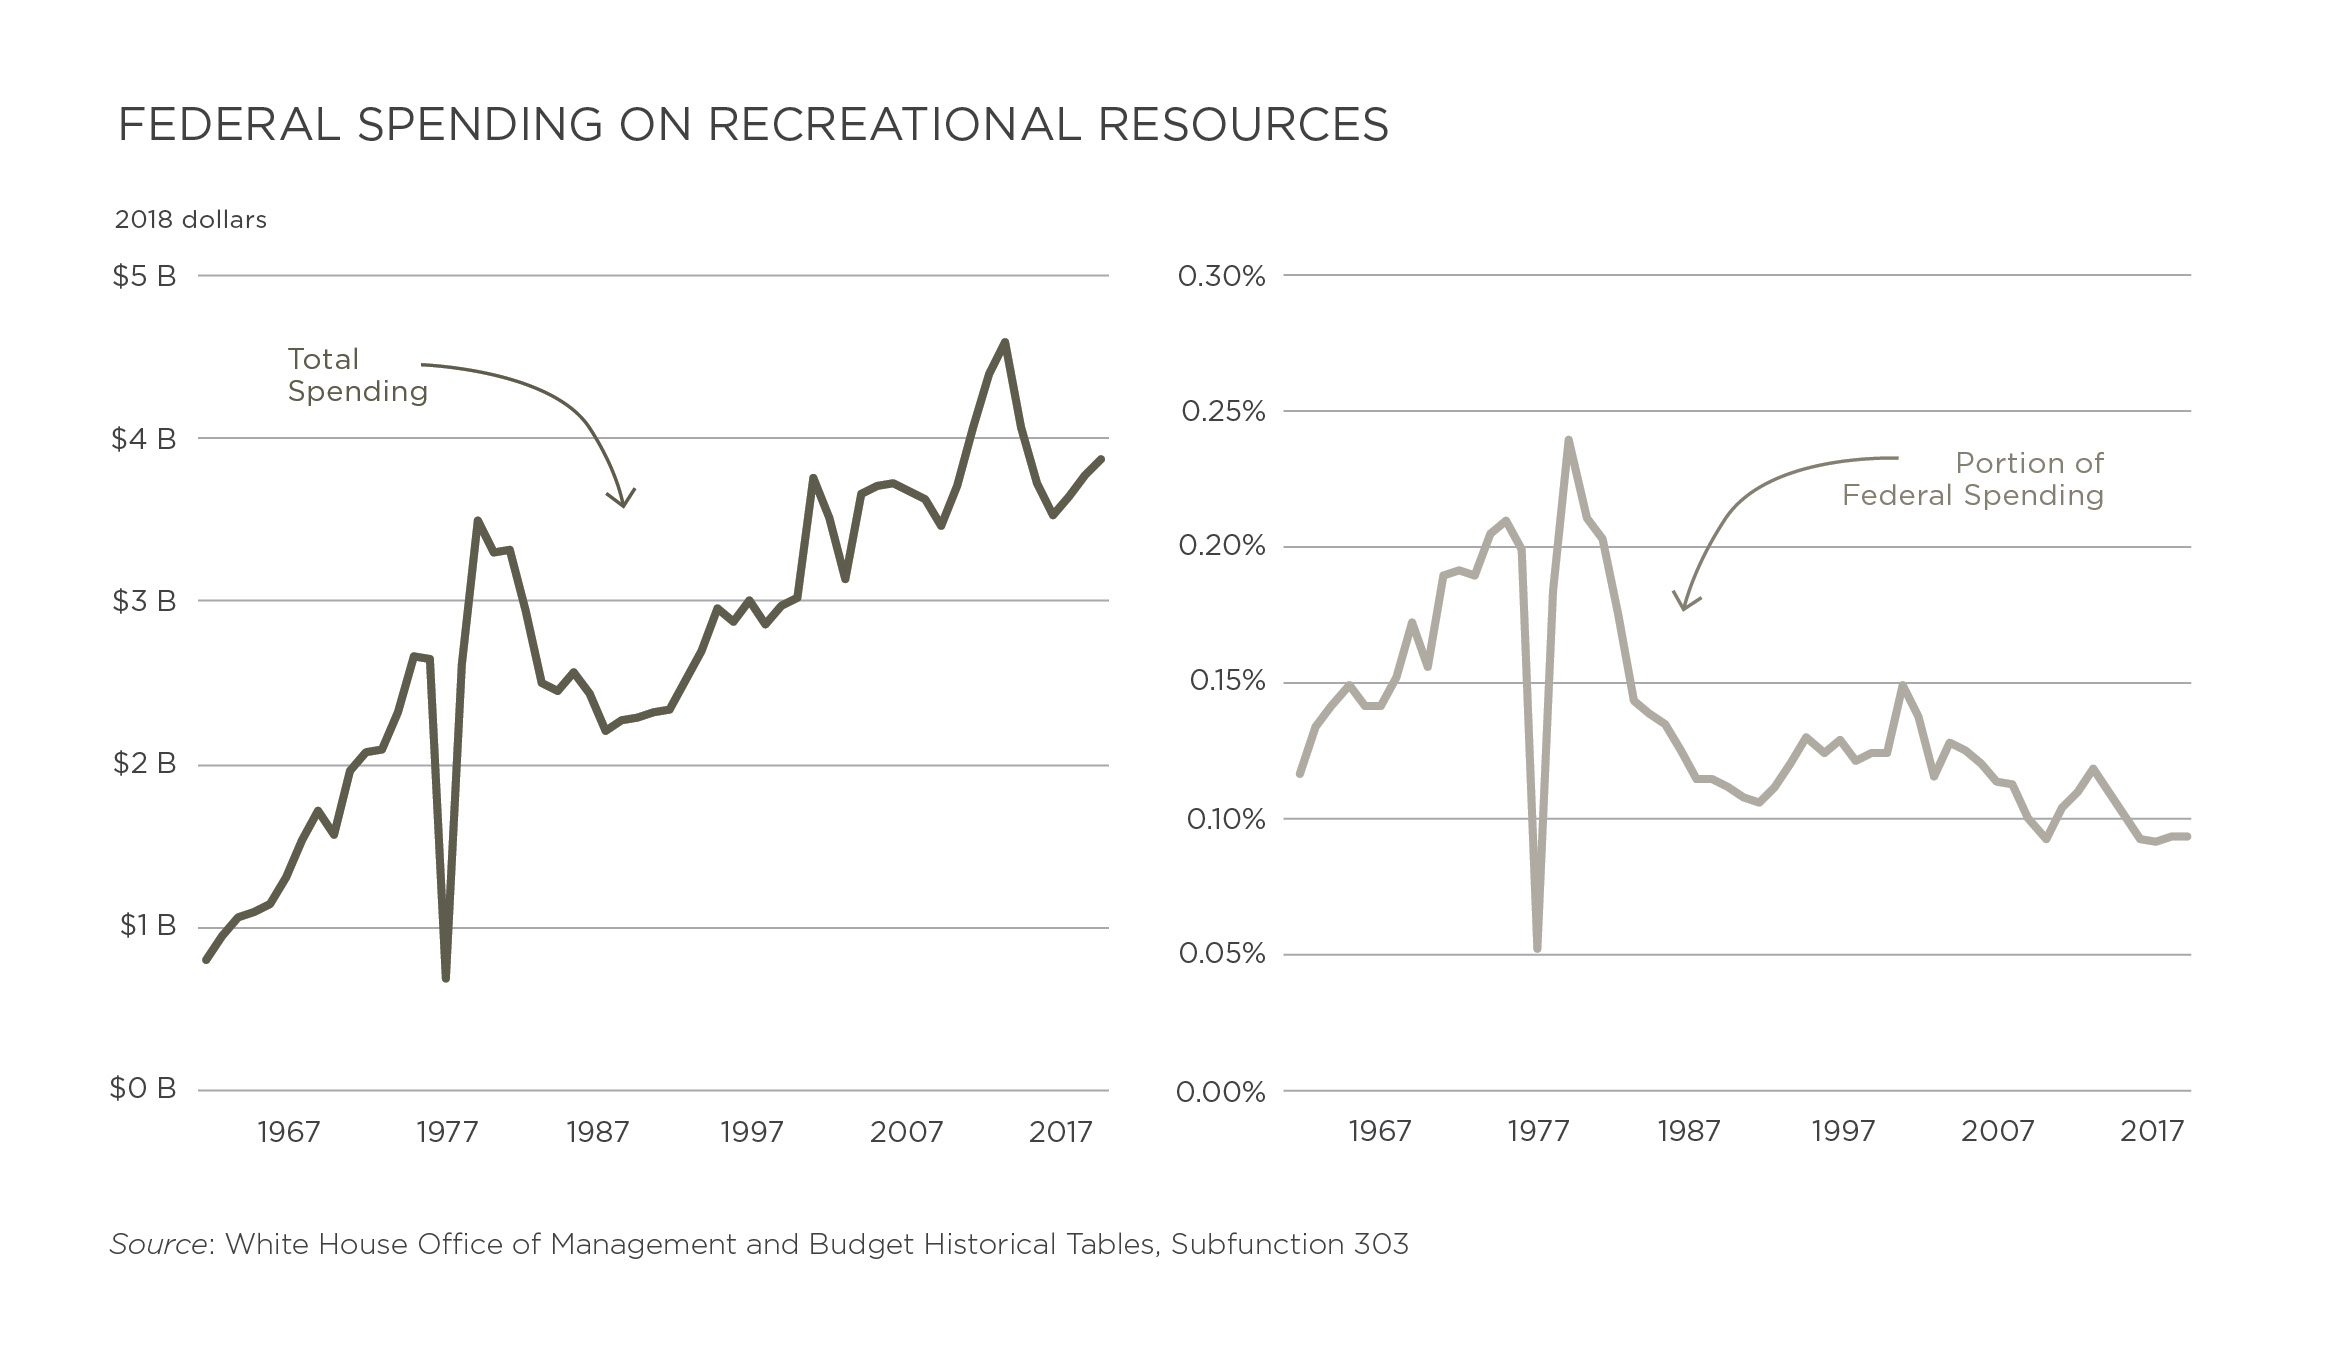
Within Function 300, Subfunction 303 covers federal outlays on recreational resources. The subfunction encompasses spending toward acquiring, operating, and improving recreational lands and facilities; managing fish, wildlife, and parks; and preserving historic areas.[7] In real terms, spending under Subfunction 303 has risen from approximately $800 million in 1962 to nearly $4 billion in 2018. As a share of overall spending, however, the subfunction comprises just 0.09 percent of the entire federal budget today, down from 0.12 percent in 1962.[8]
Federal Land Management Agencies
Most federal spending on recreation is channeled through four of the major land management agencies. Three are housed in the Interior Department: the National Park Service, the Bureau of Land Management, and the Fish and Wildlife Service. The Forest Service is housed within the Department of Agriculture.[9]
National Park Service
The National Park Service manages roughly 80 million acres of federal lands across 419 park units, a figure that includes the country’s 61 national parks as well as hundreds of sites within the system that have other classifications, such as national monuments and national preserves.[10] Established in 1916, the mission of the National Park Service is “to conserve the scenery and the natural and historic objects and the wild life therein and to provide for the enjoyment of the same in such manner and by such means as will leave them unimpaired for the enjoyment of future generations.”[11] In 2000, the agency updated that mission, tweaking the language to accept “the validity of outdoor recreation,” a change that reflects the growing importance of recreation in the 21st century.[12]
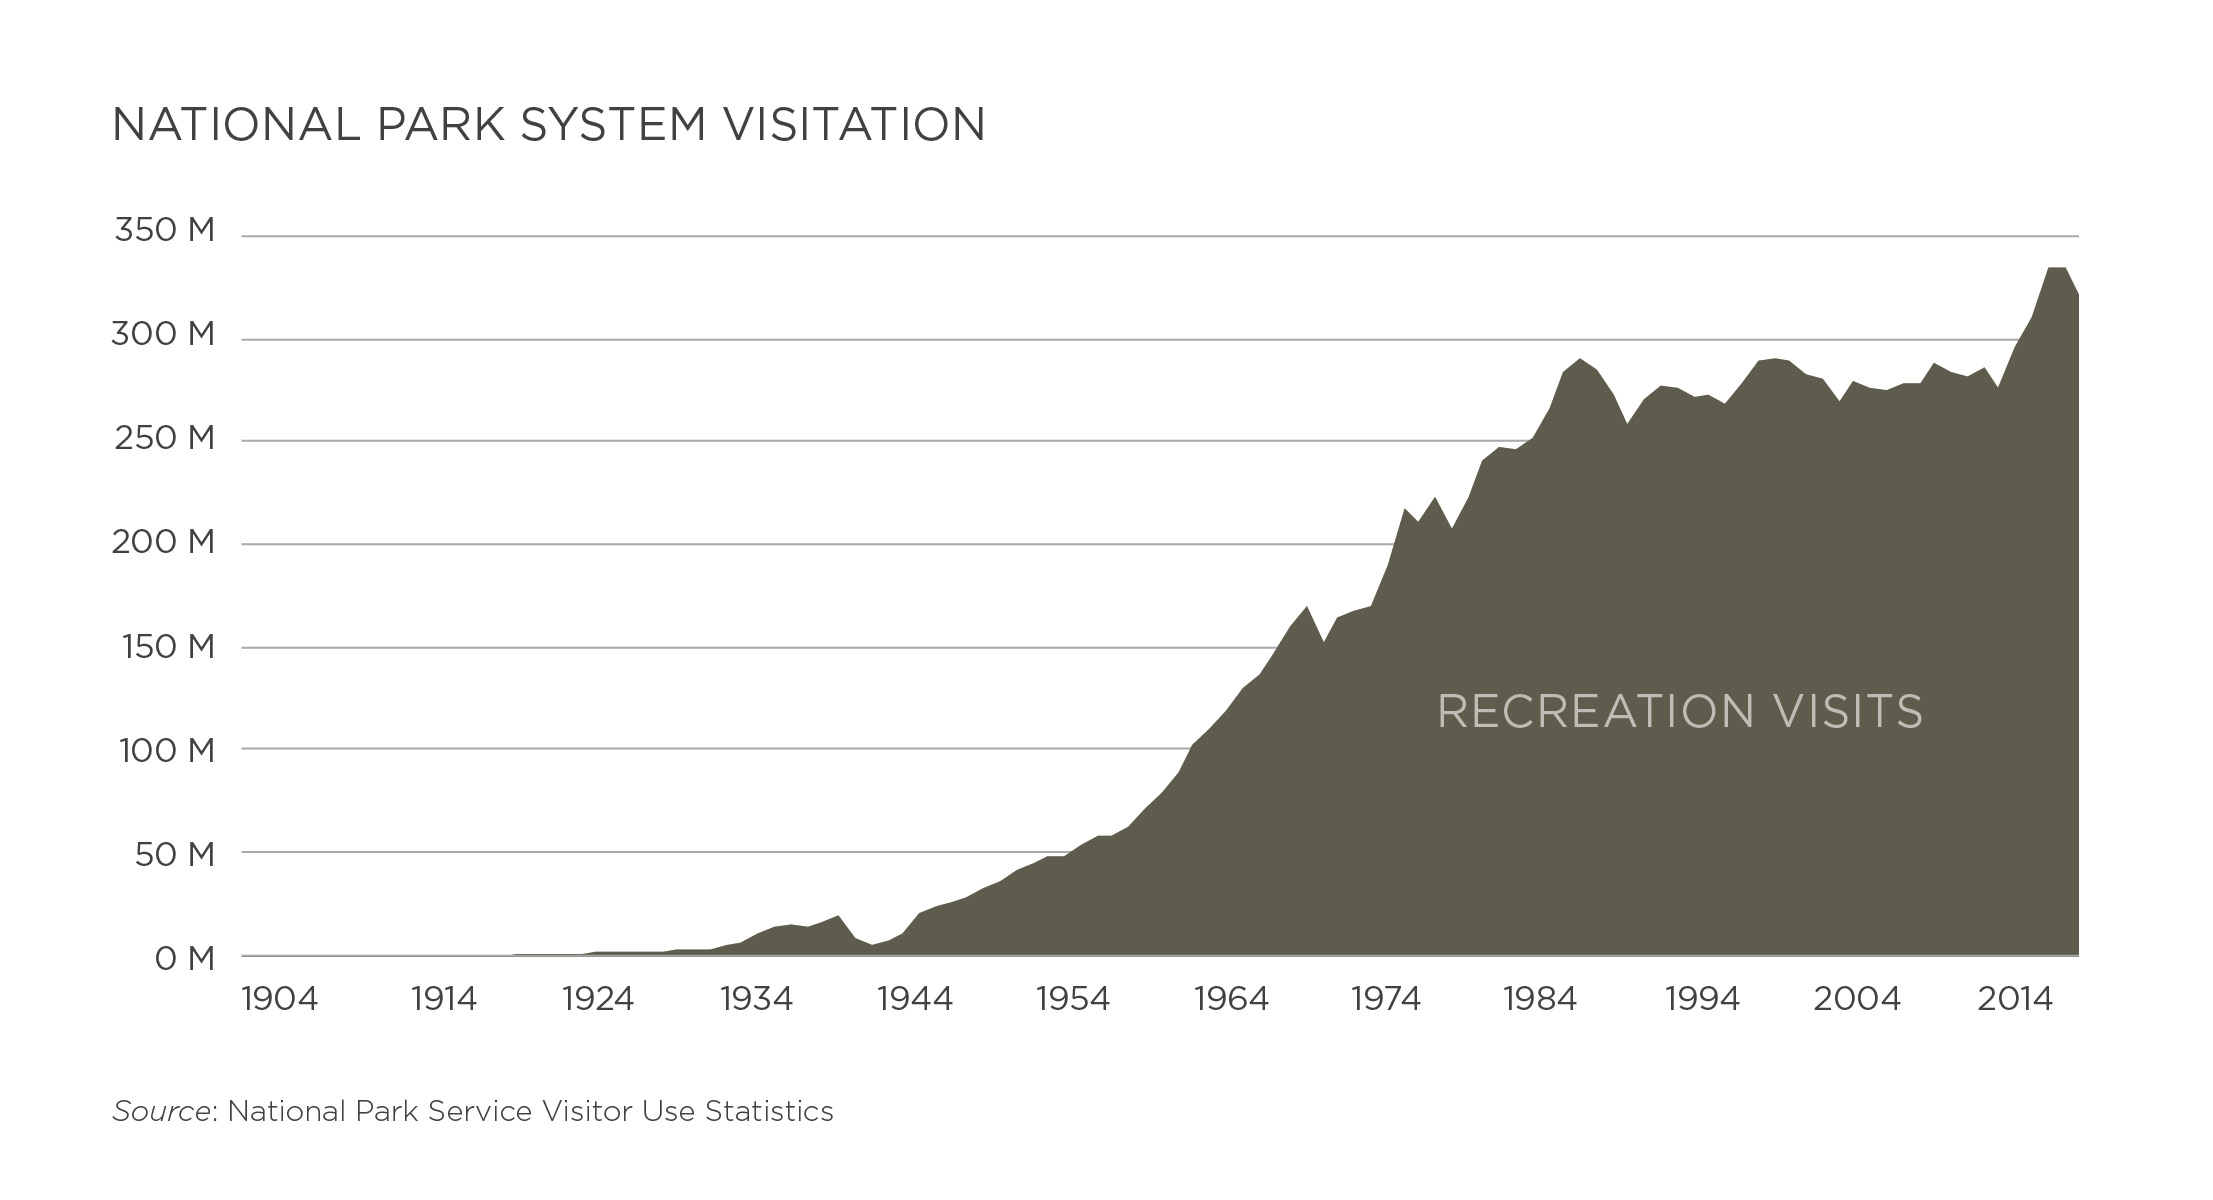
That growth is reflected in the historical trend in visitation across the National Park System. Park visitation has increased more than fourfold since 1960, when national parks and other agency-managed units received 72 million visits.[13] More recently, after nearly three decades of relatively flat visitation that began in the late 1980s, visits to the park system have surged since 2013, increasing by 16 percent in just five years. The uptick is likely due to various factors, including the park service’s centennial celebration in 2016 as well as the rise of outdoor recreation generally. In 2016 and 2017, systemwide visitation reached all-time highs of nearly 331 million visits, before falling to 318 million visits in 2018. Even with the overall decline last year, 28 individual sites set new visitation records.[14]
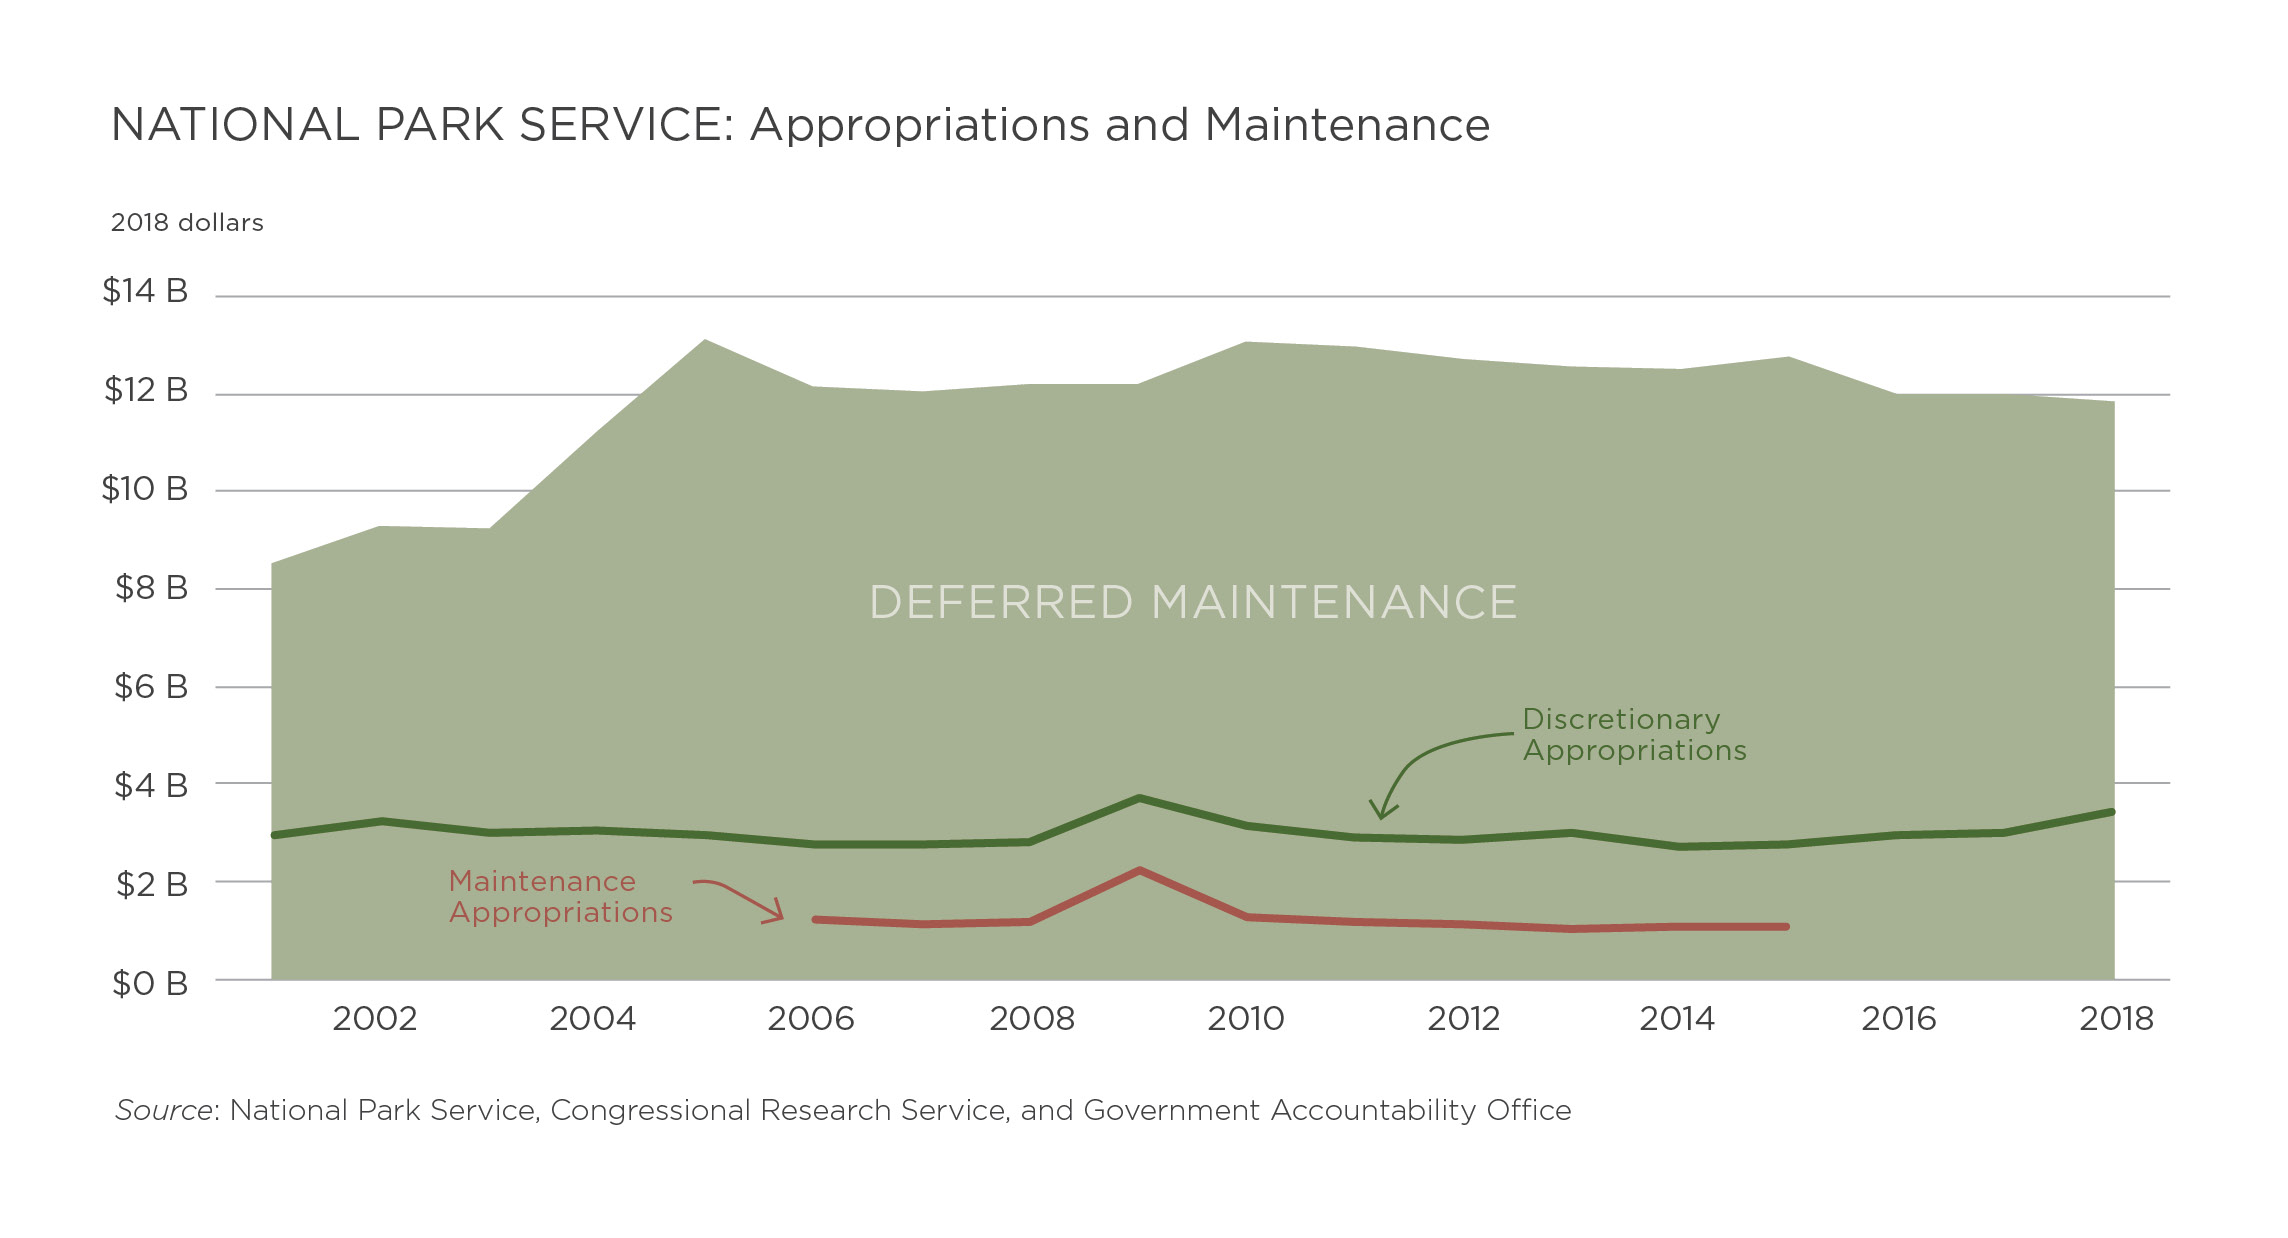
The story is largely the same when it comes to the portion of parks appropriations devoted to maintenance. According to a recent Government Accountability Office report, from 2006 to 2015 the park service received about $1 billion each year for maintenance projects—about one-third of the agency’s appropriations.[16] This funding has not been sufficient to keep up with the maintenance needs of aging park assets and infrastructure, a factor that has contributed to the nearly $12 billion of deferred maintenance that has accumulated across the agency’s 419 units.[17]
In terms of asset types, paved roads account for more than half of the maintenance backlog. About 40 percent of paved roads in national parks are considered to be in “poor” or “fair” condition.[18] While the recreational access provided by roads is a crucial part of the park experience for a majority of visitors, improvements to roads and bridges in parks have historically been funded through the Department of Transportation, not the National Park Service.[19]
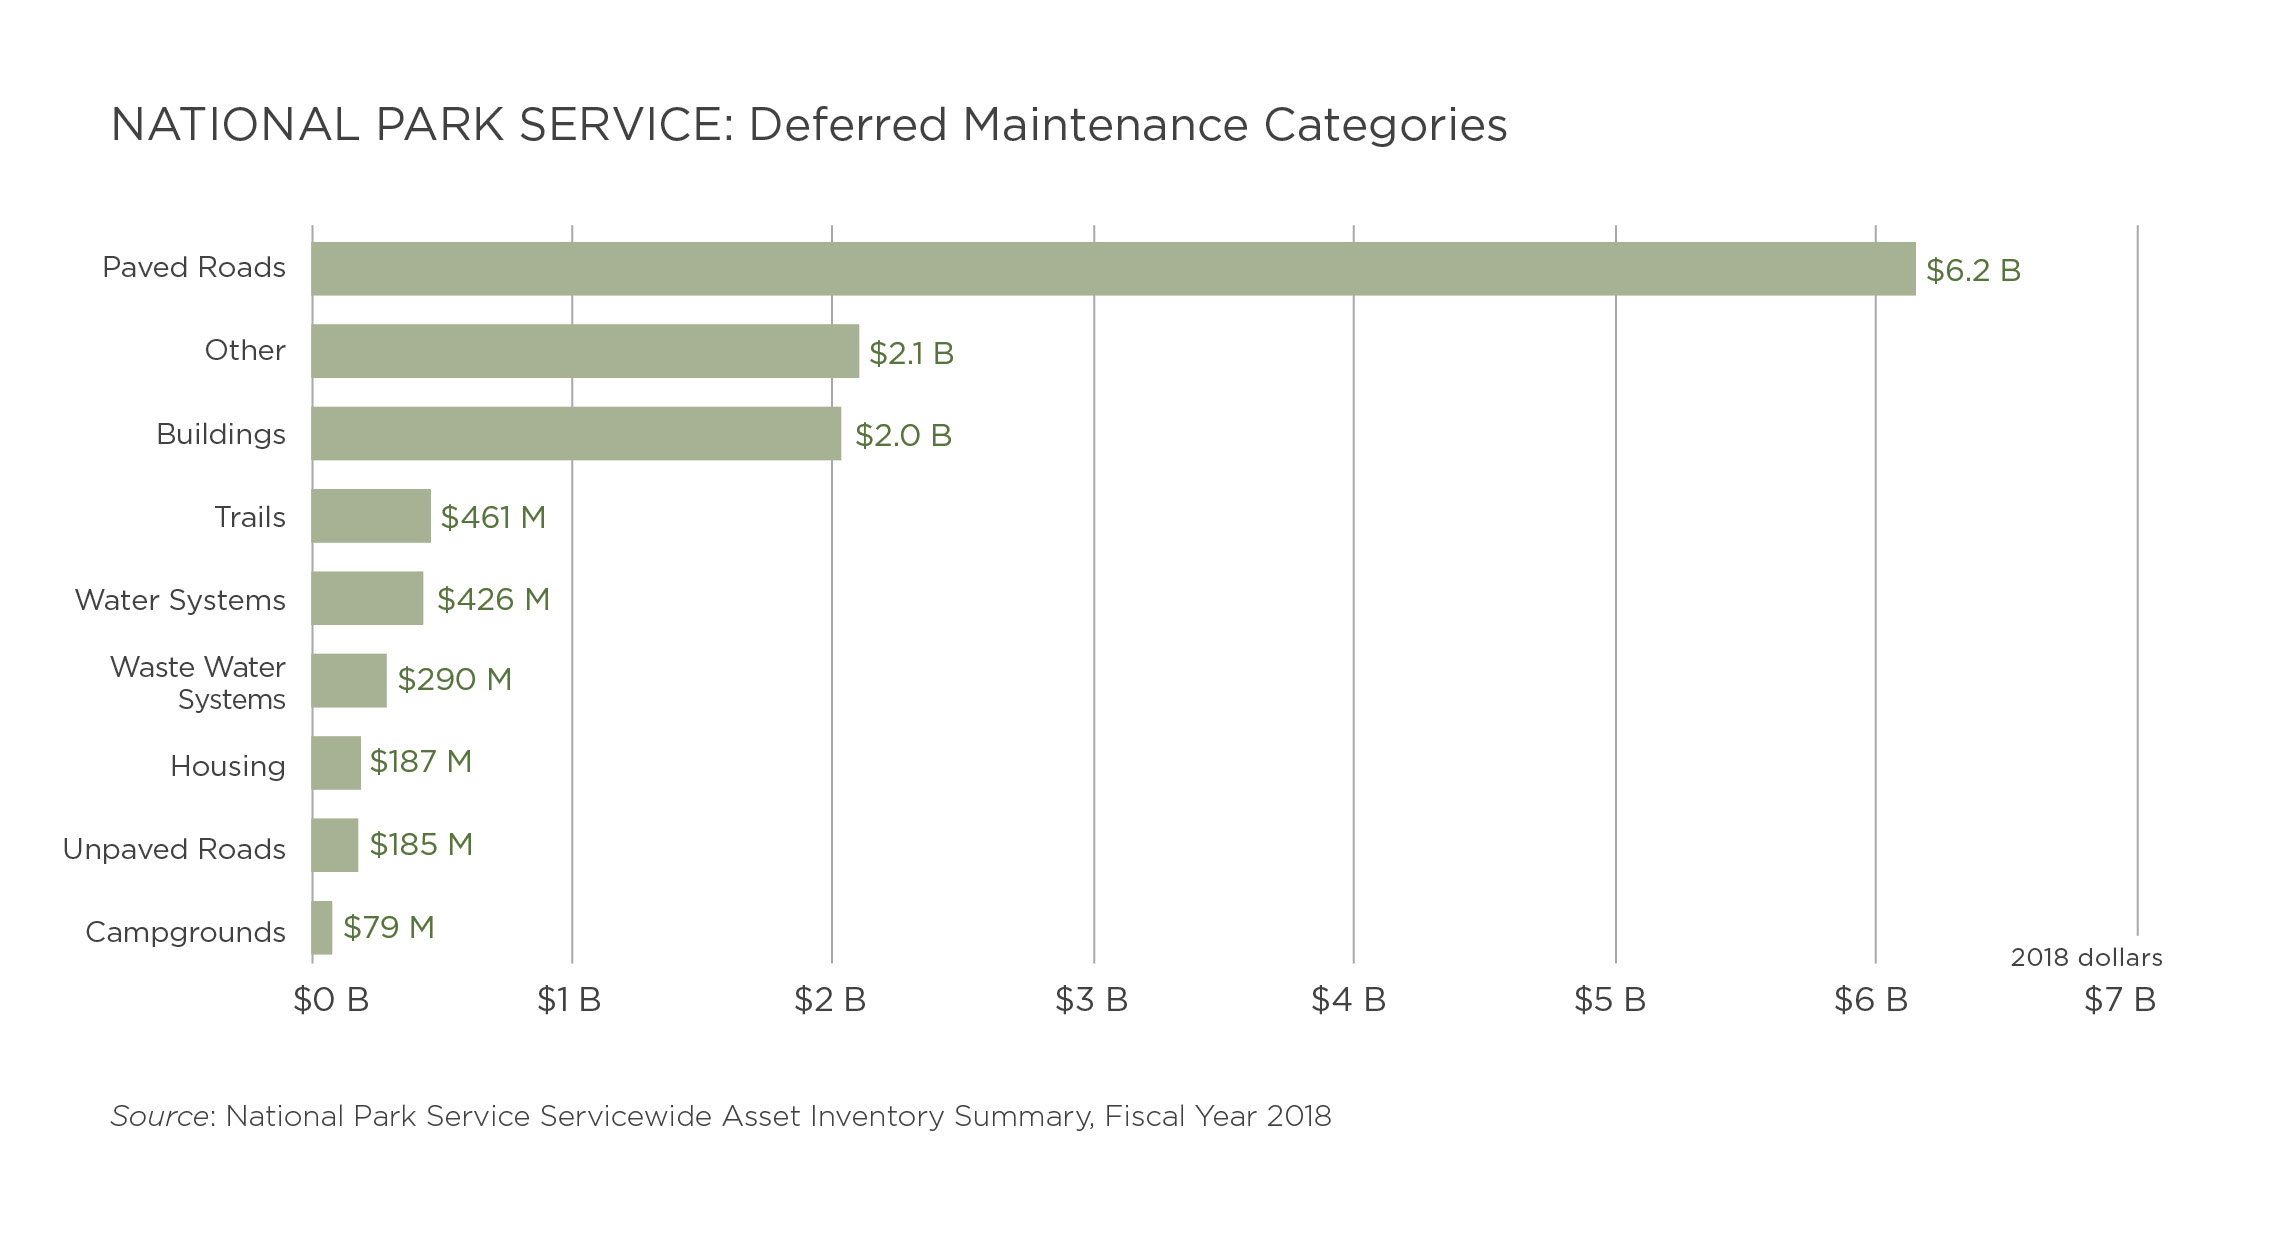
The system of trails across national parks, on the other hand, is a recreational asset whose maintenance responsibilities fall squarely to the National Park Service. Hiking trails are arguably the archetype of human-powered recreation. And throughout the national park system, thousands of miles of trails are rated as “poor” or “seriously deficient.”[20] The breakdown of deferred maintenance shows that across all parks nearly half a billion dollars is required for trail repairs alone.
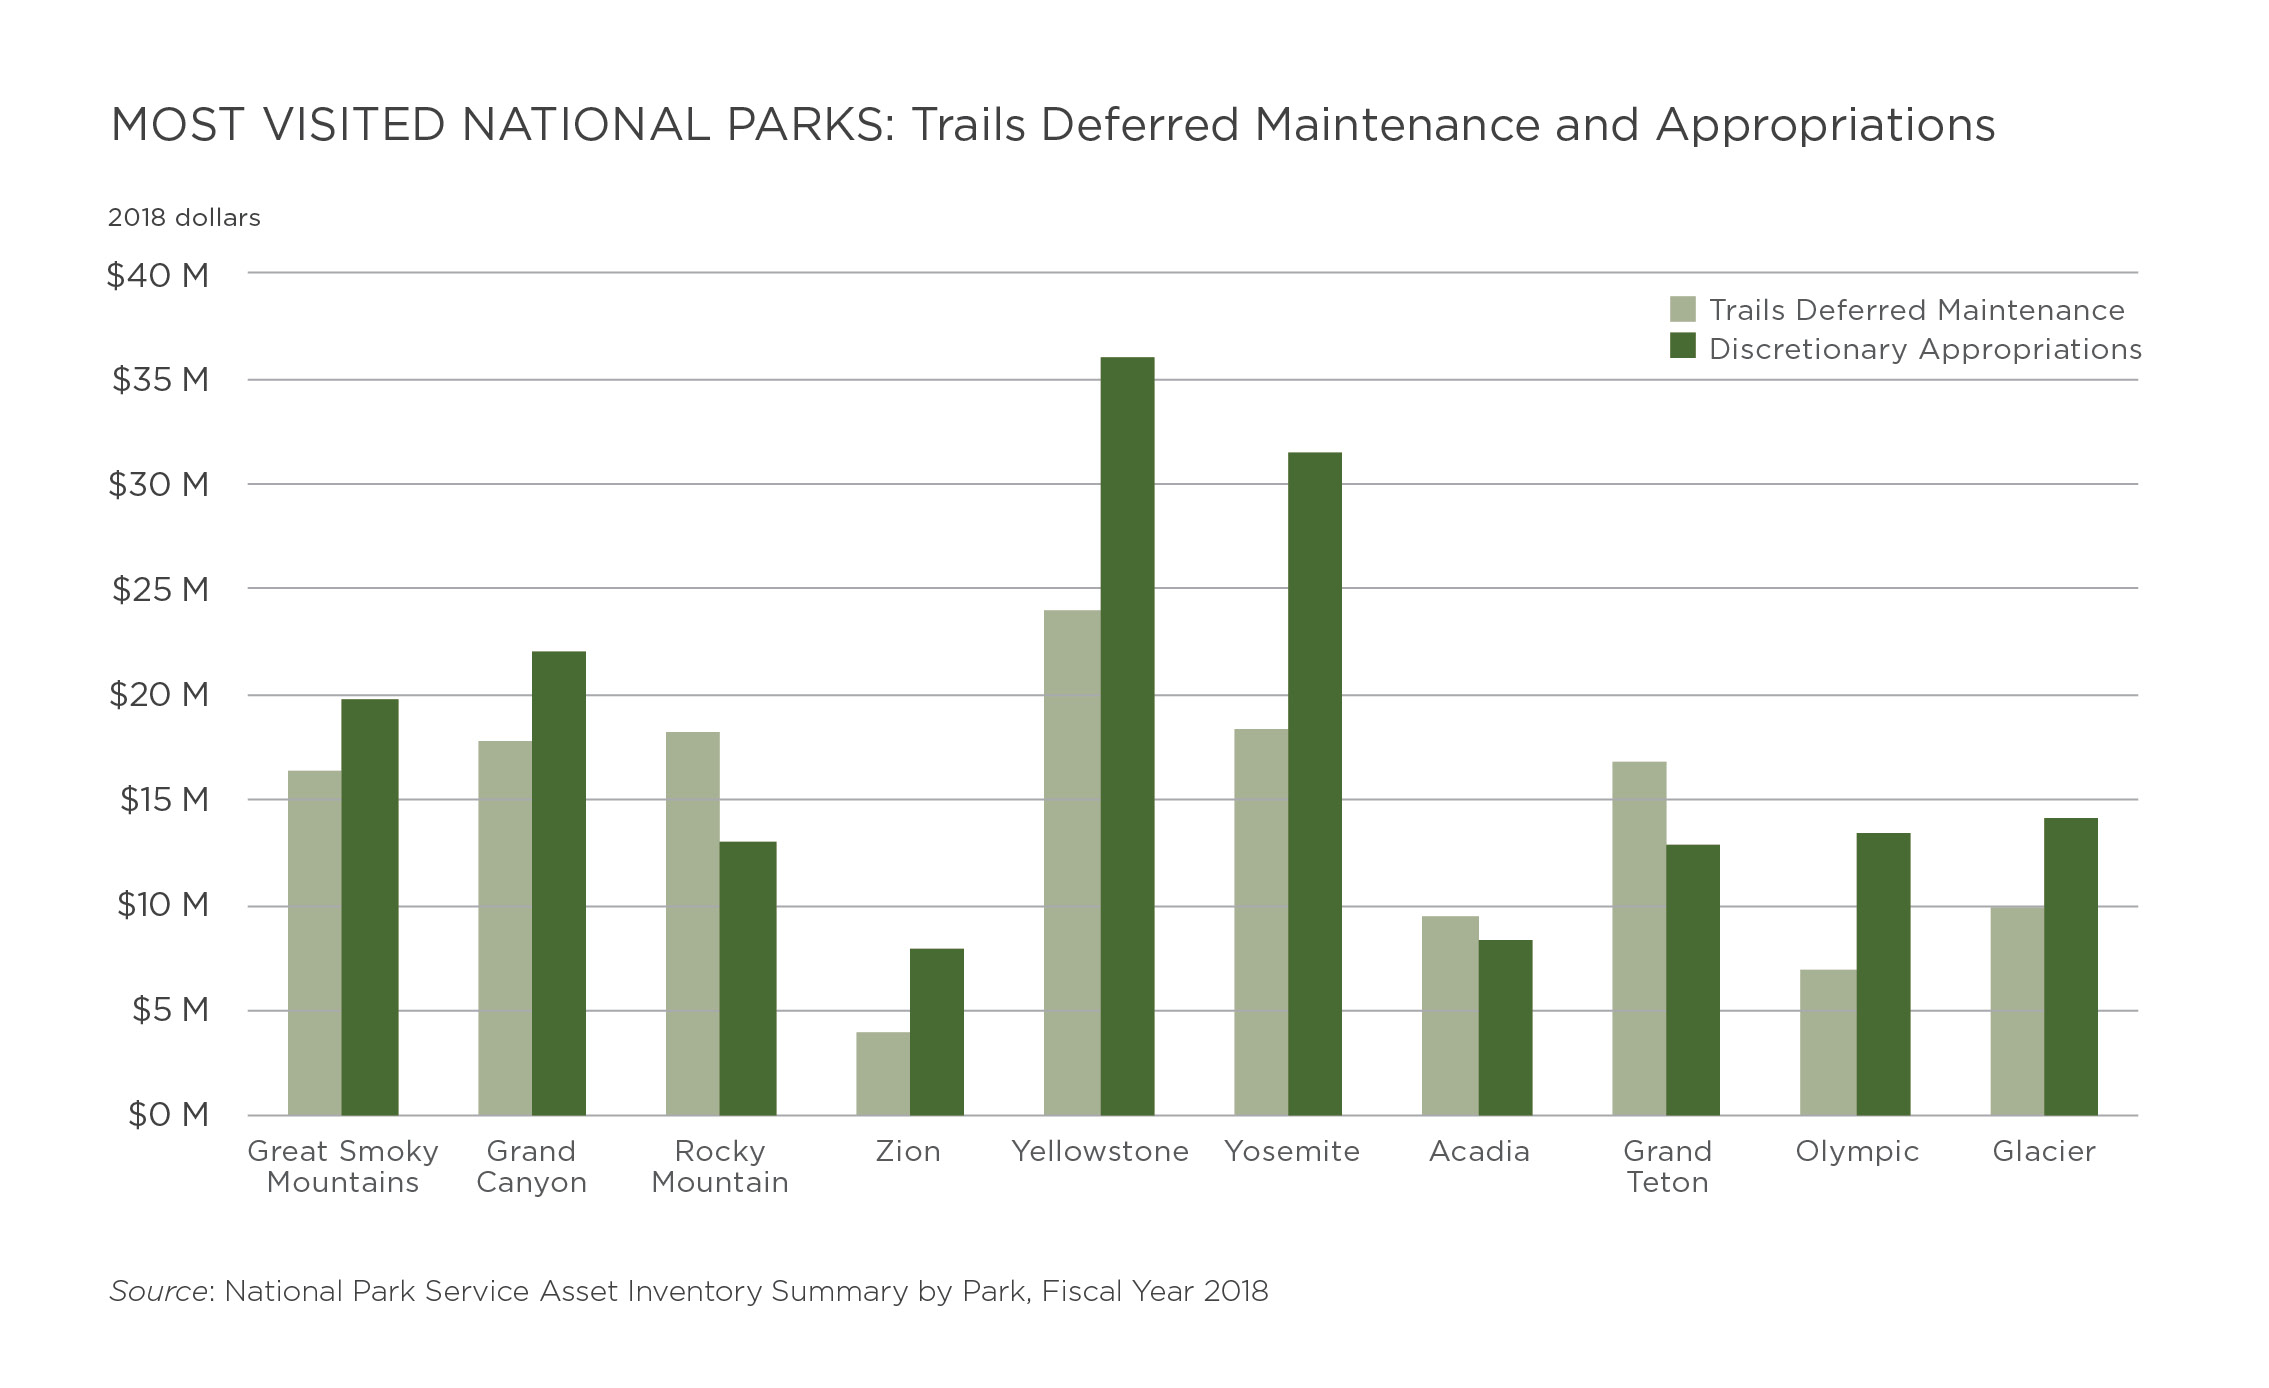
A look at the 10 most visited parks in the country gives a sense of the magnitude of the challenge facing many sites. Three out of the 10 parks have trail maintenance backlogs that exceed the amount of funding they received in discretionary appropriations last year, meaning that even if those parks devoted all of their appropriations to trails projects, they still would not fully address their trail maintenance needs. In fact, the combined trails maintenance backlog for the 10 most popular parks would equal 79 percent of their combined appropriations.[21] The story is much the same for other recreation-related assets within the National Park System, including visitor centers, historic buildings, water and wastewater systems, and employee housing. Clearly, national parks are facing enormous and daunting maintenance challenges.
Forest Service
The Forest Service manages more than 190 million acres of land for multiple uses such as timber management, livestock grazing, wildlife and fish habitat, and recreation.[22] National forests provide ample outdoor recreation opportunities, from hiking, biking, and horseback riding to hunting, dirt biking, and camping. The Forest Service manages approximately 30,000 developed recreation sites nationwide.[23] The agency faces a deferred maintenance backlog of its own of nearly $5.5 billion, including $279 million in unfunded trail repairs.[24]
According to visitor surveys conducted by the agency, visitation to national forests has remained relatively steady over the past decade. In 2016, there were an estimated 148 million recreation visits to national forests.[25]
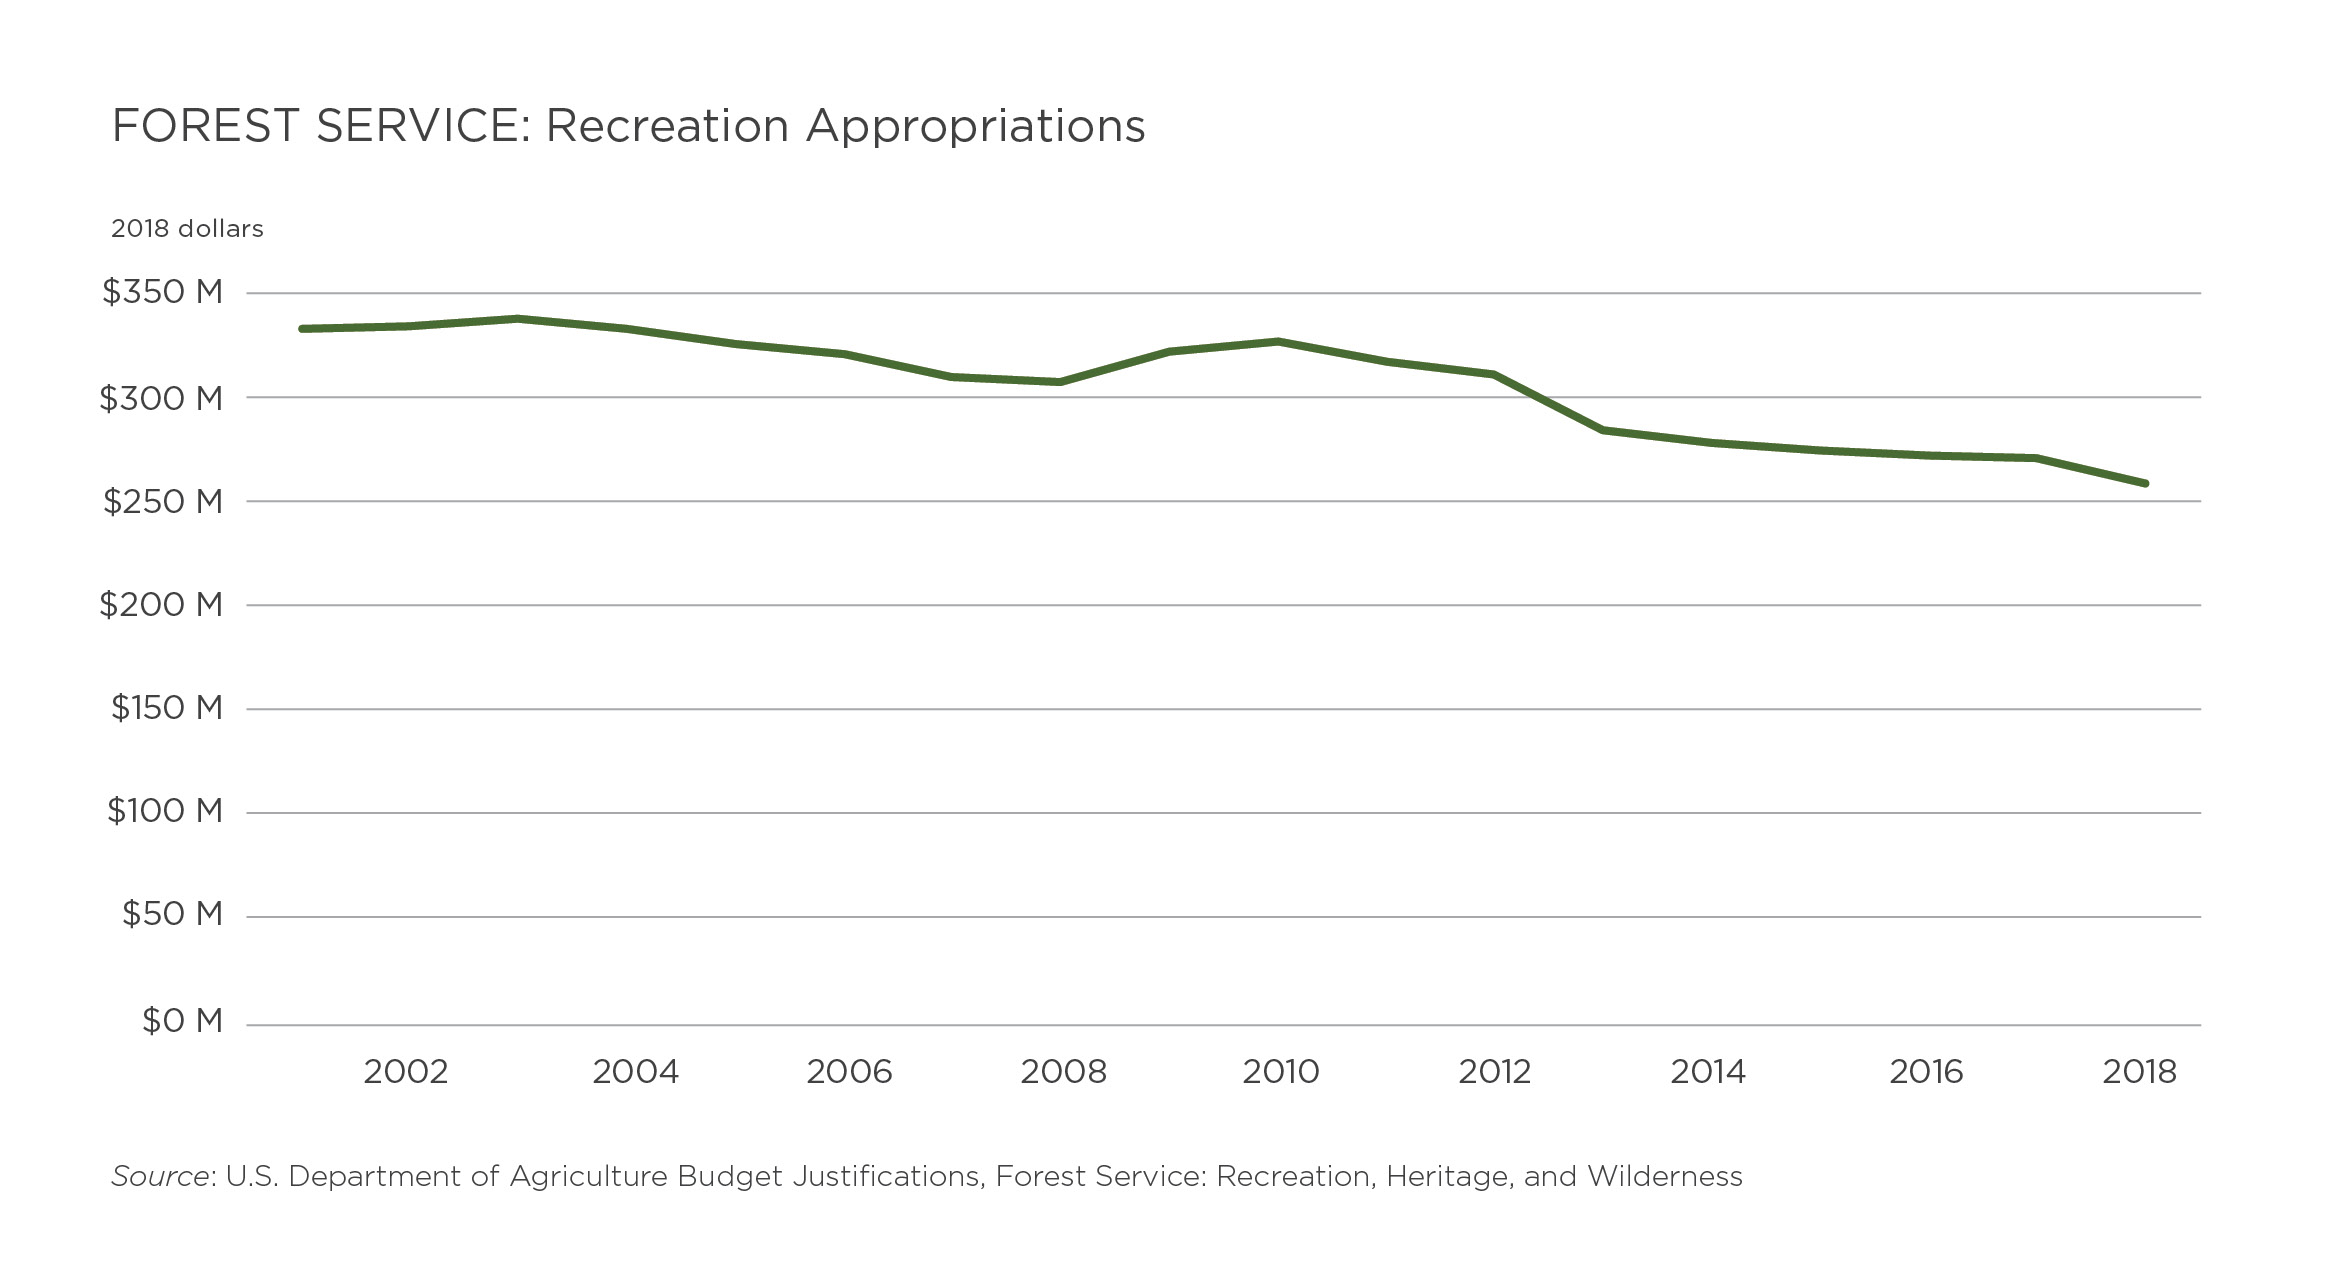
The main Forest Service account that covers recreation spending is the agency’s Recreation, Heritage, and Wilderness account. The agency calls recreation “the single greatest use” of national forest lands, and expenditures from the account support various activities, including visitor center and campground operations as well as management of permits for ski areas, marinas, and lodges.[26] Appropriations to the account have been falling gradually in recent years, decreasing by 23 percent since 2001, after adjusting for inflation. The agency received $258 million in appropriations to the account in 2018—less than its trail maintenance backlog and equivalent to approximately $1.74 per recreation visit.[27]
Bureau of Land Management
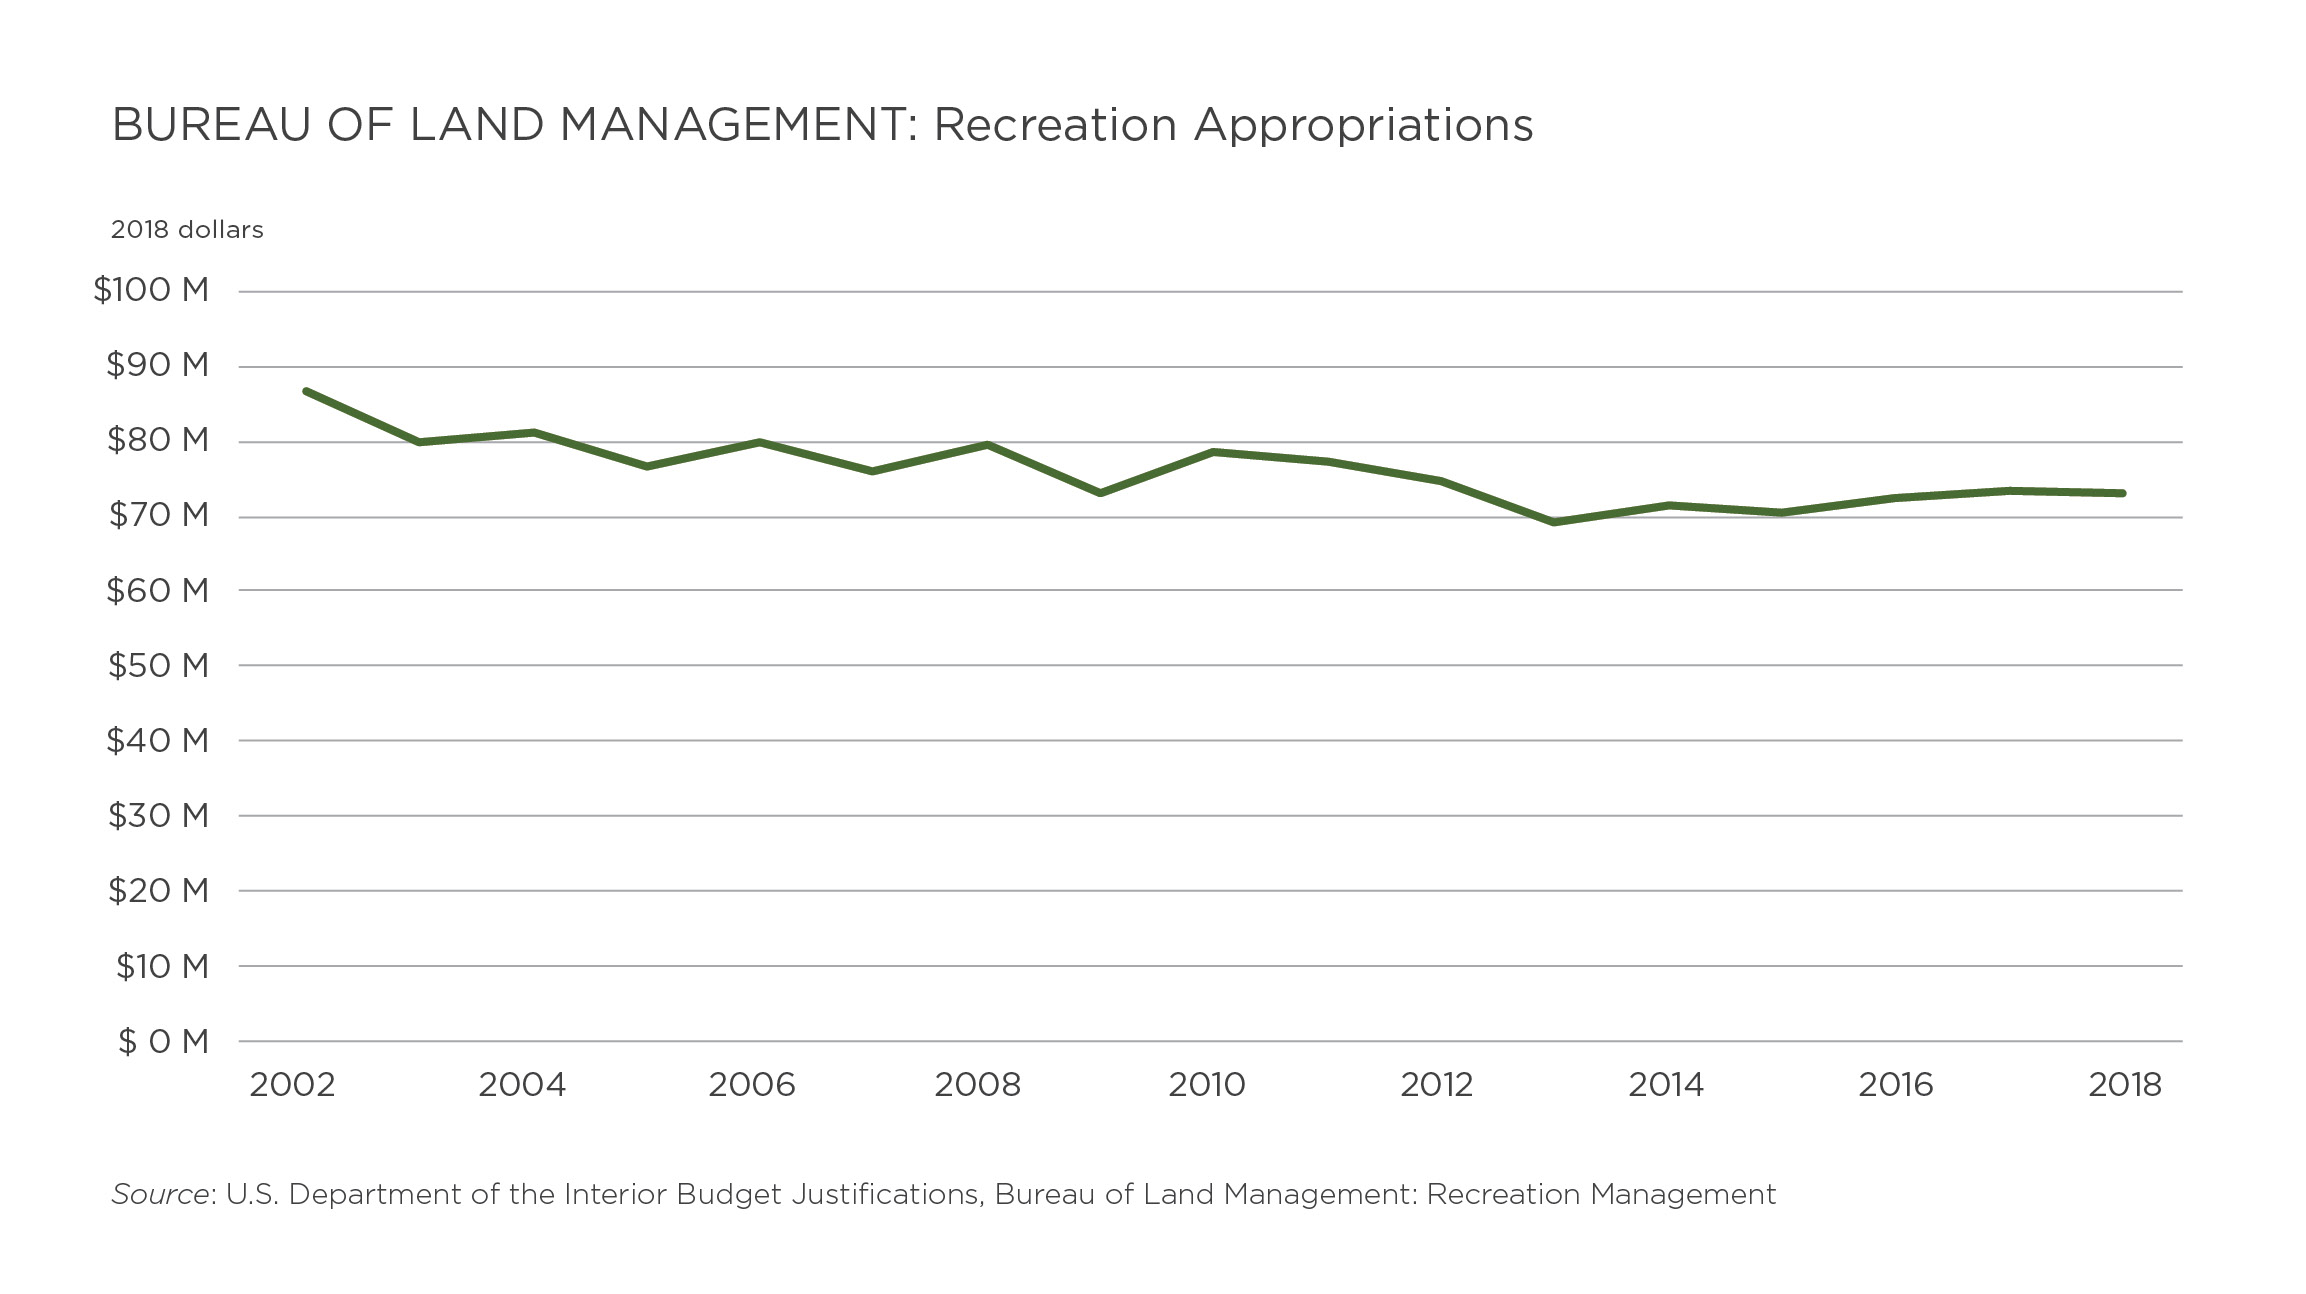
The Bureau of Land Management is the nation’s largest landlord, managing nearly 250 million acres of federal land.[28] While grazing, timber, and conservation are important management responsibilities for the agency, recreation falls under its multiple-use mandate as well. The agency’s deferred maintenance backlog has grown by 65 percent over the past decade in real terms and is currently estimated at $810 million. Approximately three-quarters of the agency’s deferred maintenance consists of roads, bridges, and trails.[29]
Bureau of Land Management sites offer ample recreation opportunities, including hiking, hunting, fishing, camping, climbing, visiting cultural and historic sites, off-road vehicle driving, mountain biking, wildlife viewing, and more. The agency’s 4,000 recreation sites receive approximately 67 million visits annually, an increase of about 30 percent since 2001.[30]
After adjusting for inflation, appropriations to the agency for recreation management have fallen by 16 percent since 2001. Appropriations for recreation management totaled $73 million in 2018, or roughly $1.09 per recreation visit.[31]
Fish and Wildlife Service
The Fish and Wildlife Service manages nearly 90 million acres of federal lands. Its primary mission is to conserve plants and animals, although other uses, including recreation, are permitted so long as they do not interfere with the primary mission.[32] The agency manages 460 wildlife refuges that are open to the public.[33] It reports a deferred maintenance backlog of $1.4 billion, a decrease of nearly 60 percent in real terms over the previous decade. “Other structures” and “buildings” combine to account for a little more than half of the agency’s backlog.[34]
The most prominent recreation component administered by the Fish and Wildlife Service is the Wildlife and Sport Fish Restoration Program. Its goal is to “conserve and manage fish and wildlife and their habitats for the use and enjoyment of current and future generations.”[35] The federal program disburses funds to states through grants, which carry out various conservation- and recreation-related activities with the funds. Those activities include habitat management and restoration, hunter education and safety, improvement of fishing and hunting access, and wildlife population management.[36]
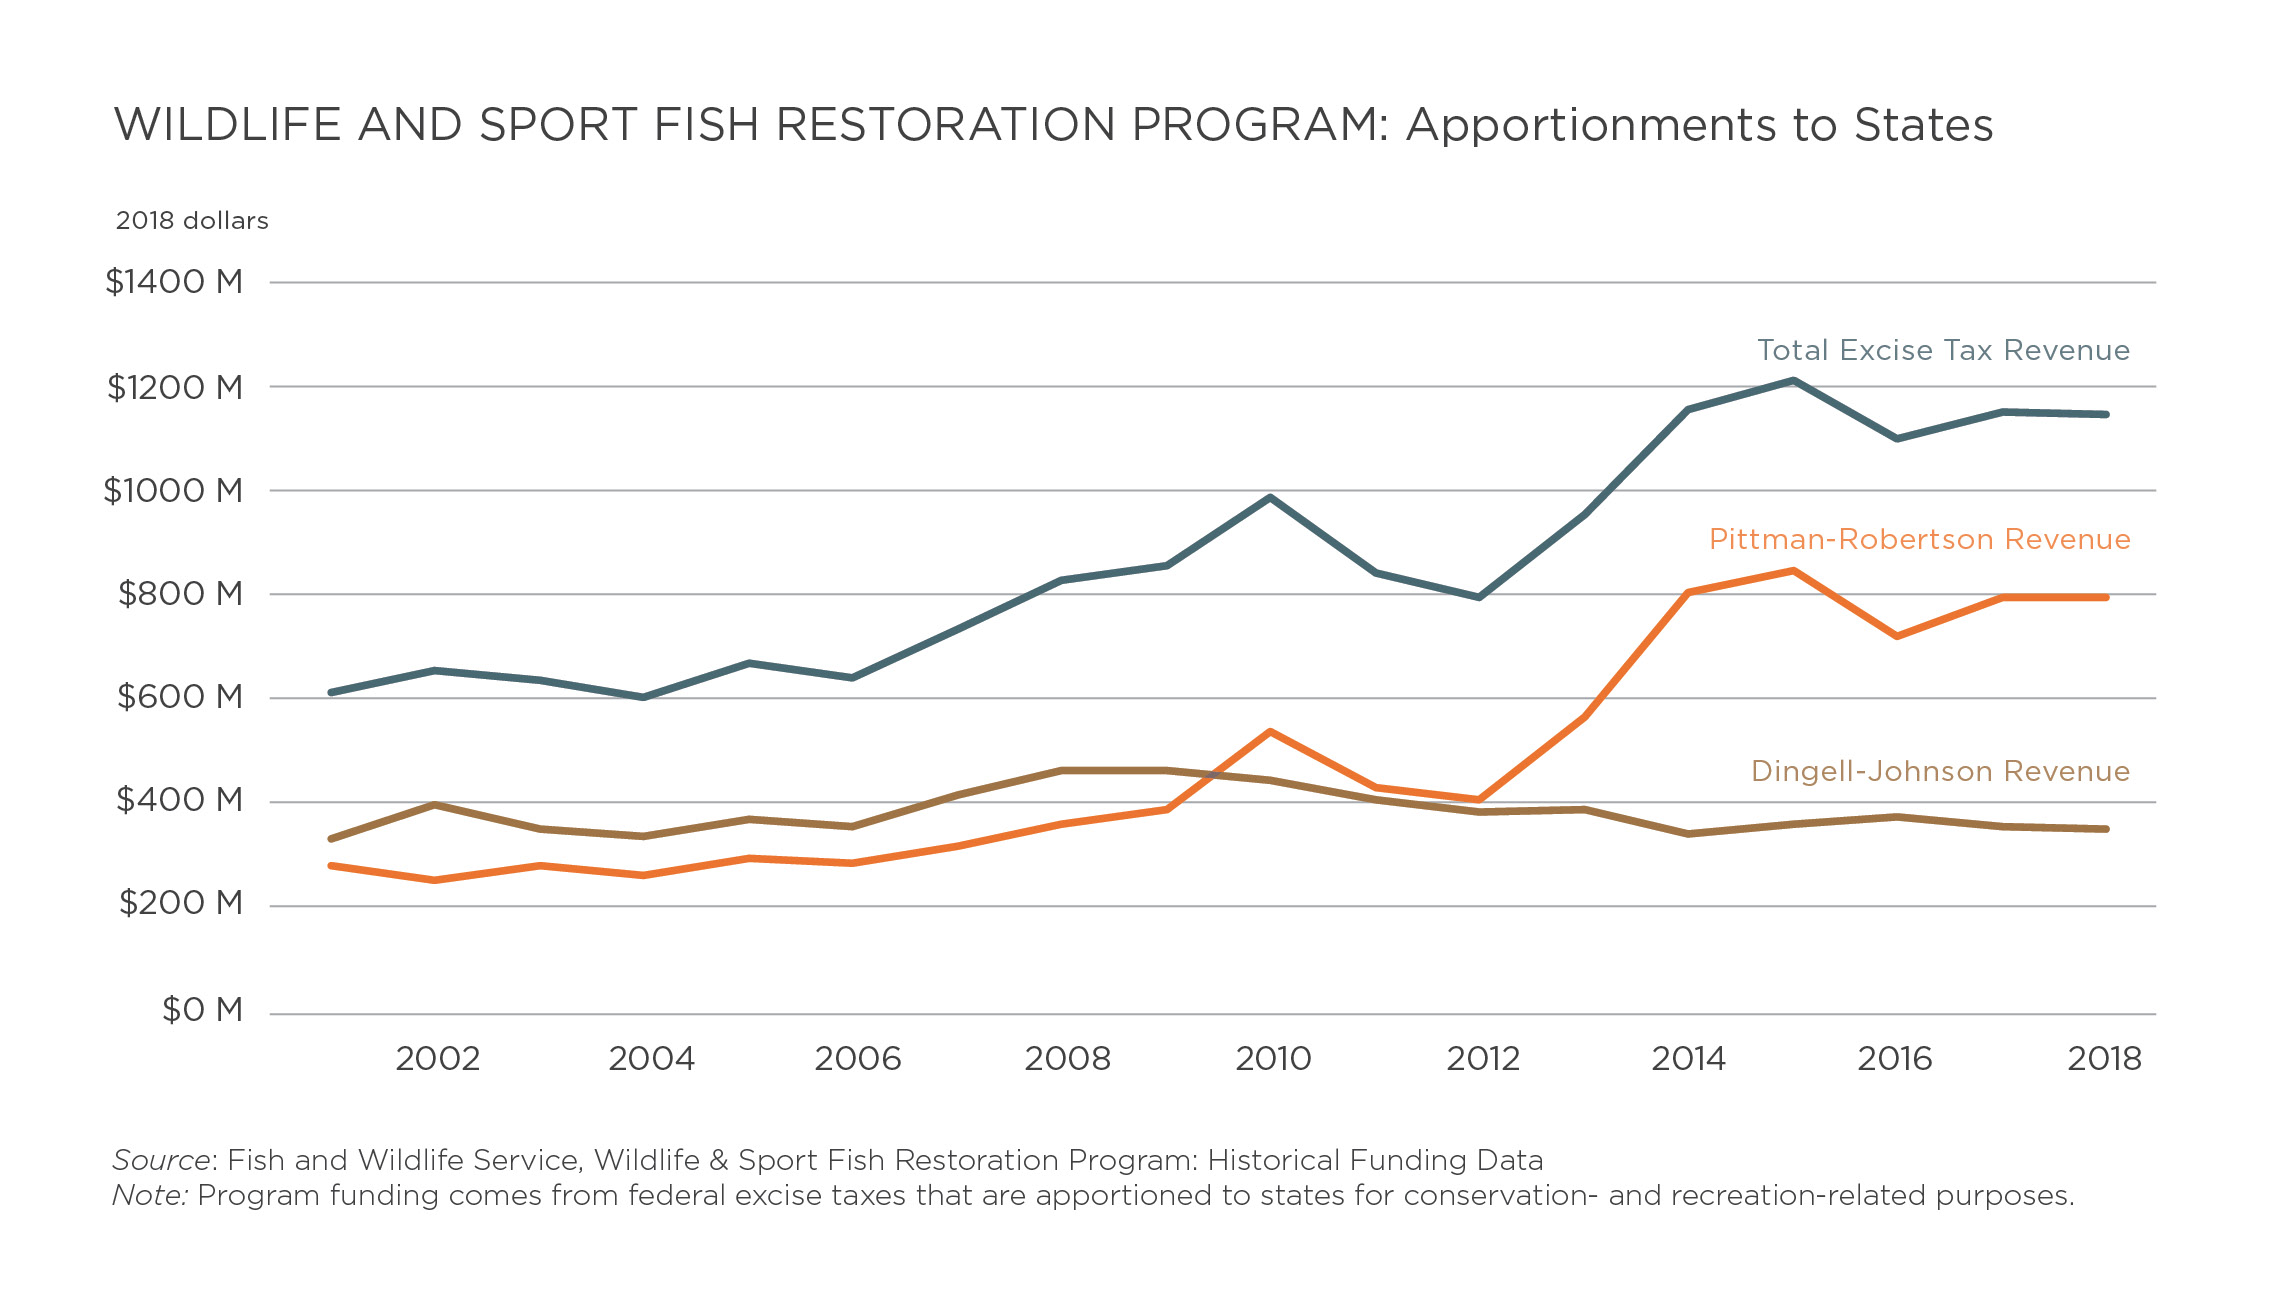
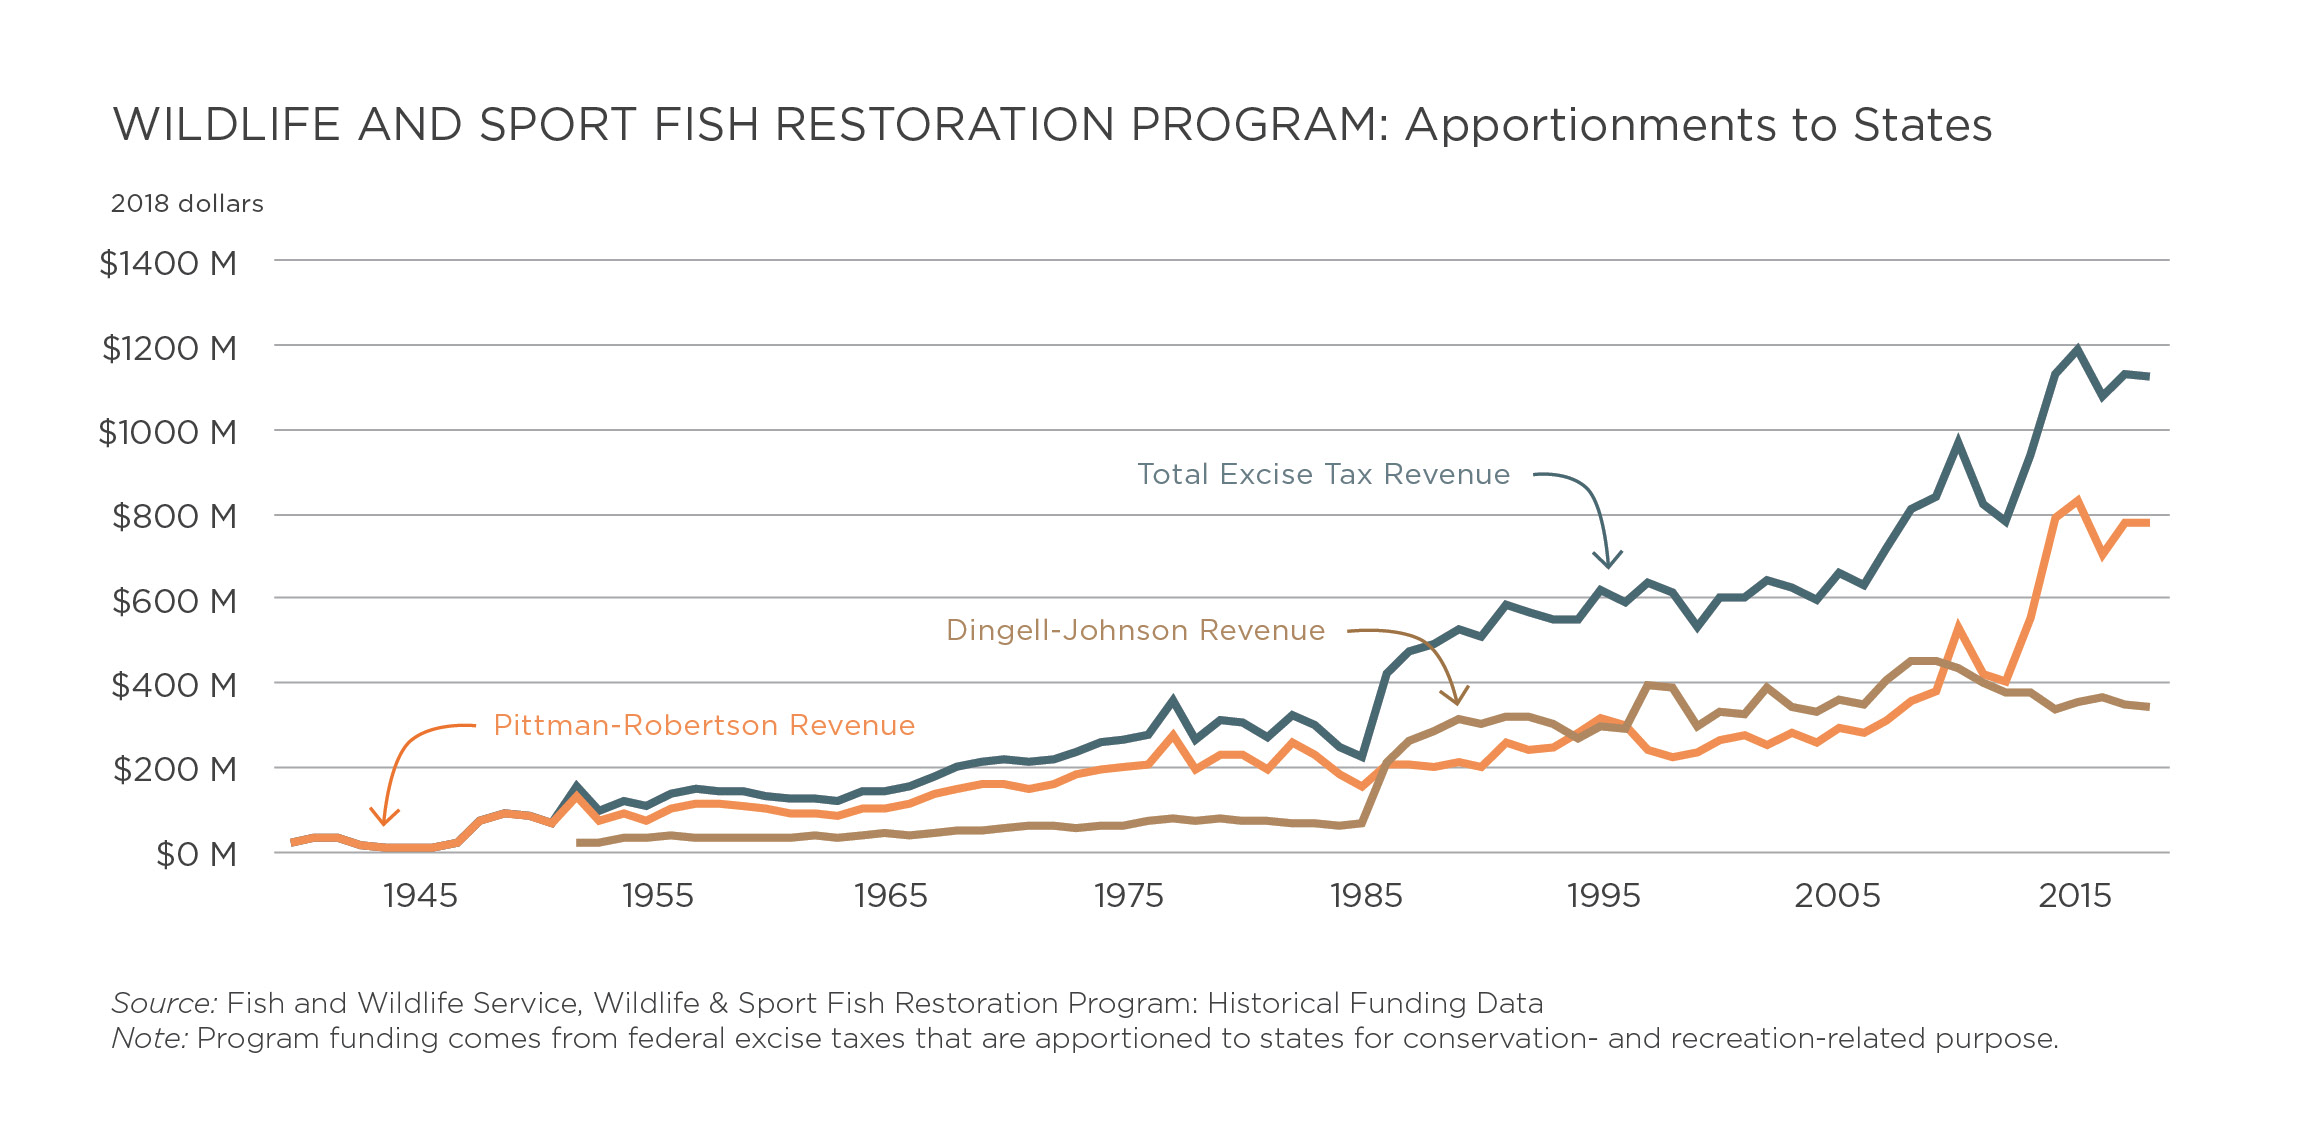
The Wildlife Restoration Program was created in 1937 by the Wildlife Restoration Act, more commonly known as the Pittman-Robertson Act, which established federal excise taxes on firearms, ammunition, and archery equipment for the purpose of funding state-level conservation programs. The Sport Fish Restoration Act of 1950, also known as the Dingell-Johnson Act, established a similar fishing-related program. Its funding comes from excise taxes on fishing tackle and equipment and boat fuel. Both programs apportion funds to states using a formula that takes into account the number of paid license holders, and in general, funding from the programs require a state match, which is primarily funded through hunting and fishing license sales.
Pittman-Robertson and Dingell-Johnson have a long track record of funding conservation and recreation projects. The federal excise taxes distributed by the Fish and Wildlife Department are crucial sources of funding for state fish and wildlife agencies. In 2018, the two programs combined to apportion more than $1.1 billion to state fish and wildlife agencies.[37] For more detail on the historical trends of these funds, see the State Fish and Wildlife Agencies section of this report.
Fee Revenues and Donations
There are a handful of other sources of recreation funding that do not come from congressional appropriations but are nonetheless important for several federal land agencies. The first is recreation fees. The Federal Lands Recreation Enhancement Act allows certain agencies, including the National Park Service, Forest Service, and Bureau of Land Management, to charge and collect recreation fees on federal lands and waters, either for entrance to a site or for use of an amenity such as a developed campground.[38] Sites that collect fees can retain and spend 80 percent of their receipts without further appropriation. Over the past decade, total revenues collected by federal agencies under FLREA have increased by 42 percent in real terms—from $284 million in 2009 to $404 million in 2018—and virtually all of that increase has occurred over the past five years.
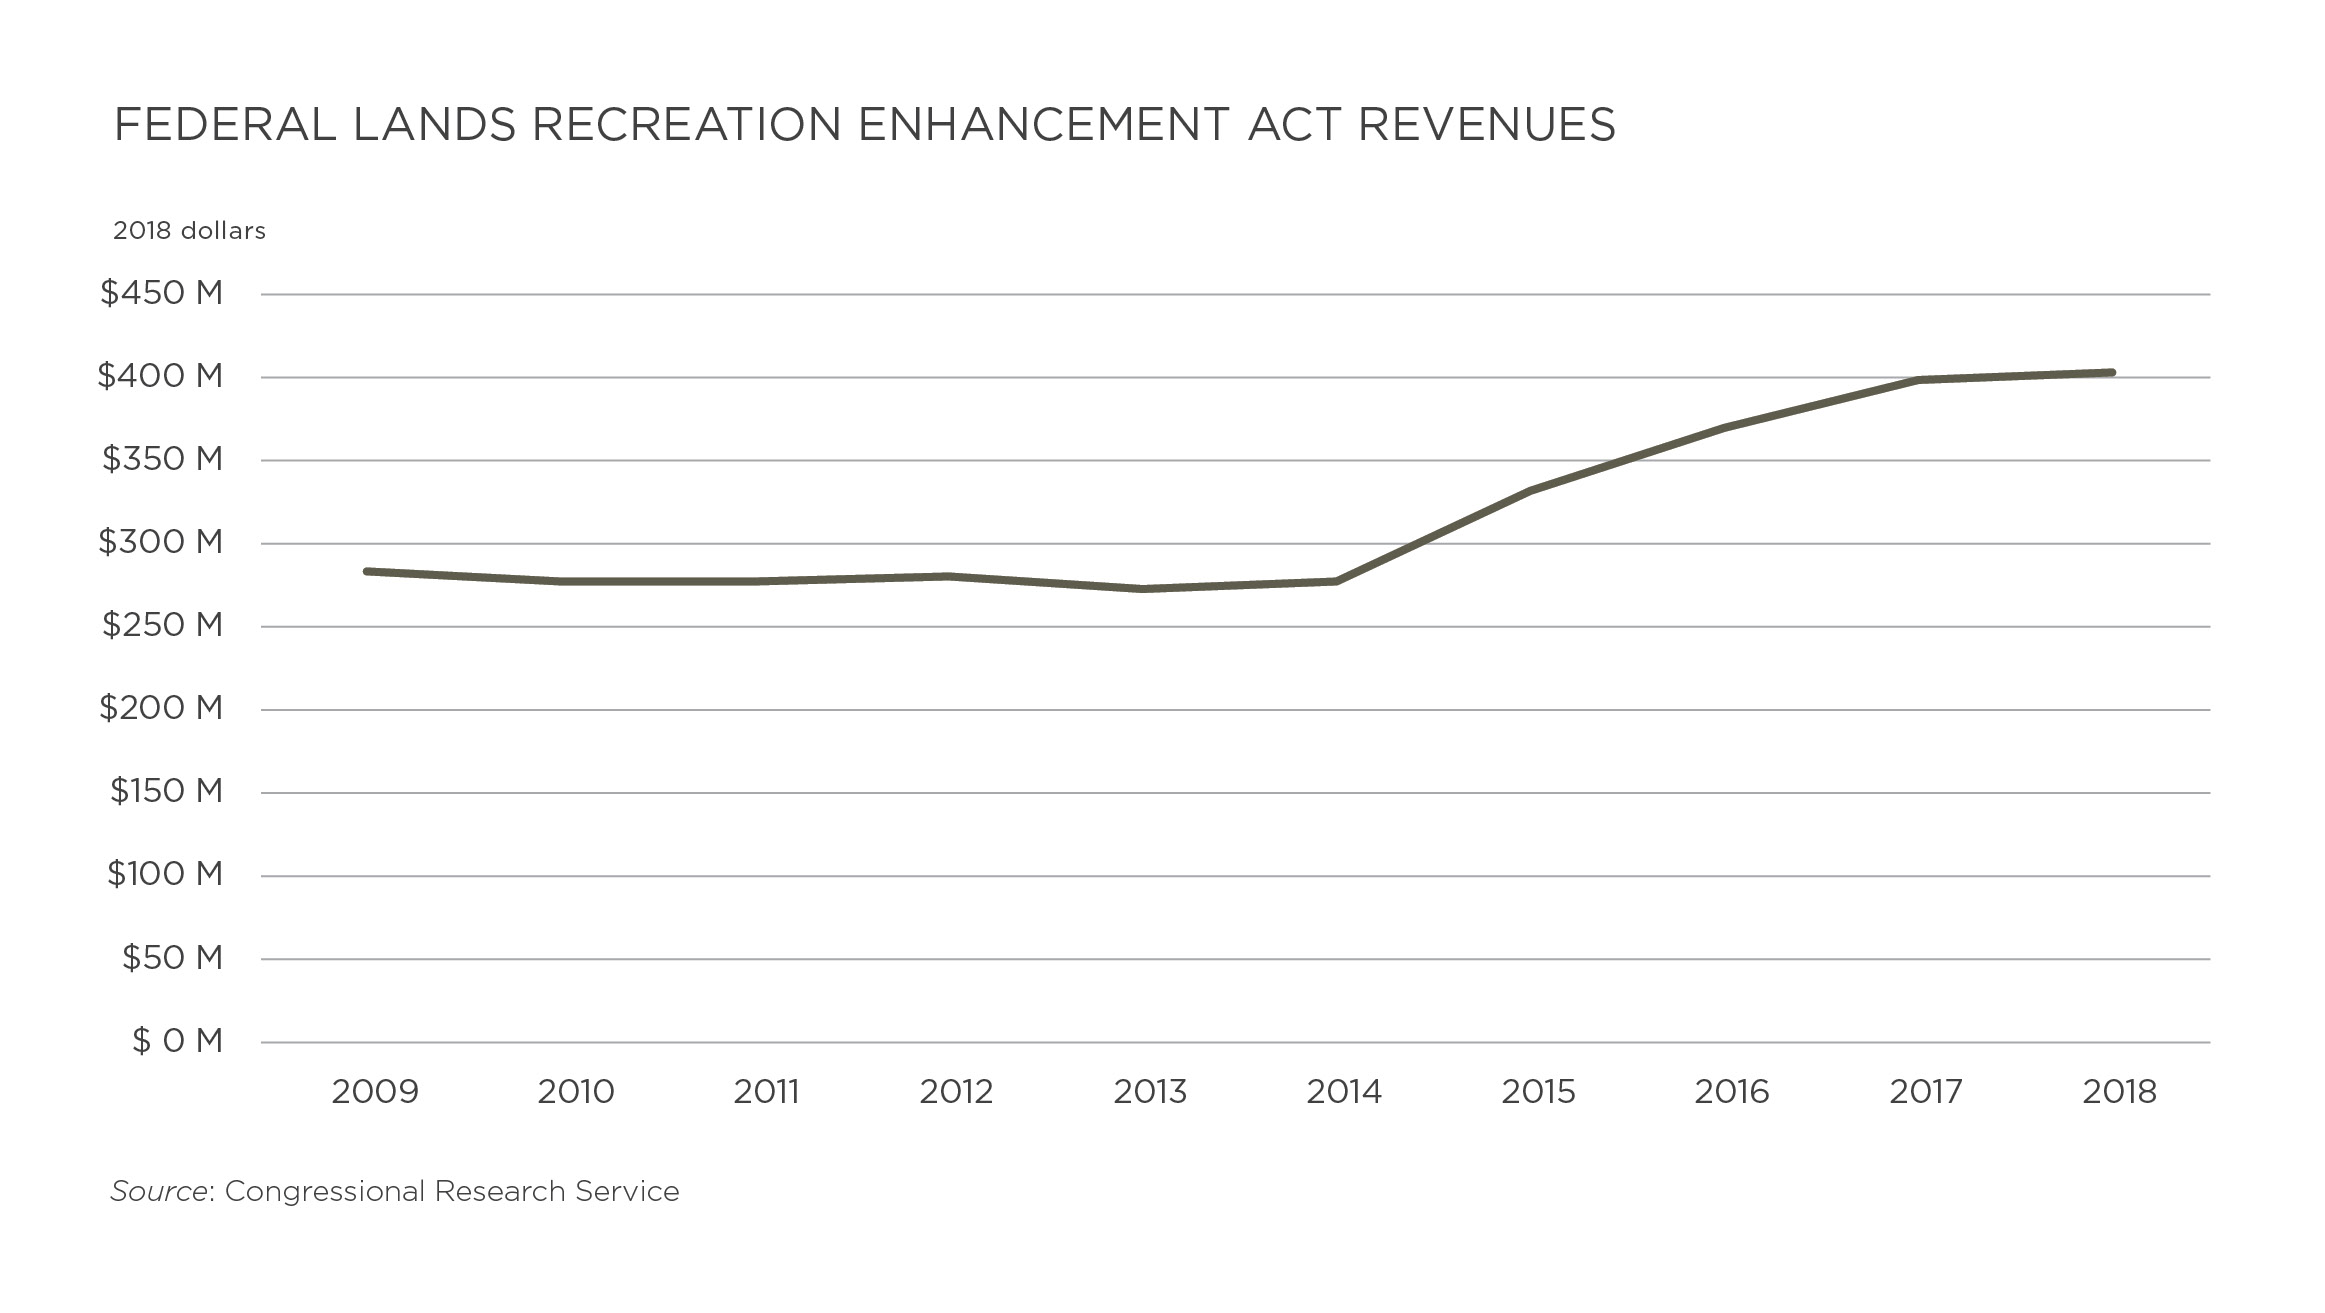
The vast majority of fee receipts come from national park units, about one-quarter of which charge entrance fees. In 2018, the National Park Service accounted for 74 percent of all FLREA receipts. The Forest Service collected 17 percent of the total.[39]
Franchise fees from concessionaires are another meaningful source of funding for certain recreation sites. Federal agencies, particularly the National Park Service and the Forest Service, outsource certain operations to private concessionaires in exchange for fees. Lodges, gift shops, and campgrounds are examples of facilities commonly operated by concessionaires. In 2018, the National Park Service generated approximately $126 million from concessions fees.[40]
Private donations are another source of funds that can help accomplish beneficial recreation projects on public lands. The nonprofit Yellowstone Forever, for example, granted $5.9 million to Yellowstone National Park in 2018 for more than 50 projects, including fish restoration efforts, trailhead displays, and black bear research.[41] And in Great Smoky Mountains National Park, a partnership with local philanthropic organizations has yielded $500,000 in donations that fund rehabilitation of many of the most popular and highest-priority trails in the park.[42] In 2018, donations to the National Park Service totaled $47 million.[43]
While these sources of funding are important, they’re a relatively small portion of the federal funds that provide recreation opportunities across public lands. In 2018, fees, concessions, and donations combined to account for approximately $475 million, or about 11 percent of the National Park Service’s total budget authority.[44]
Land and Water Conservation Fund
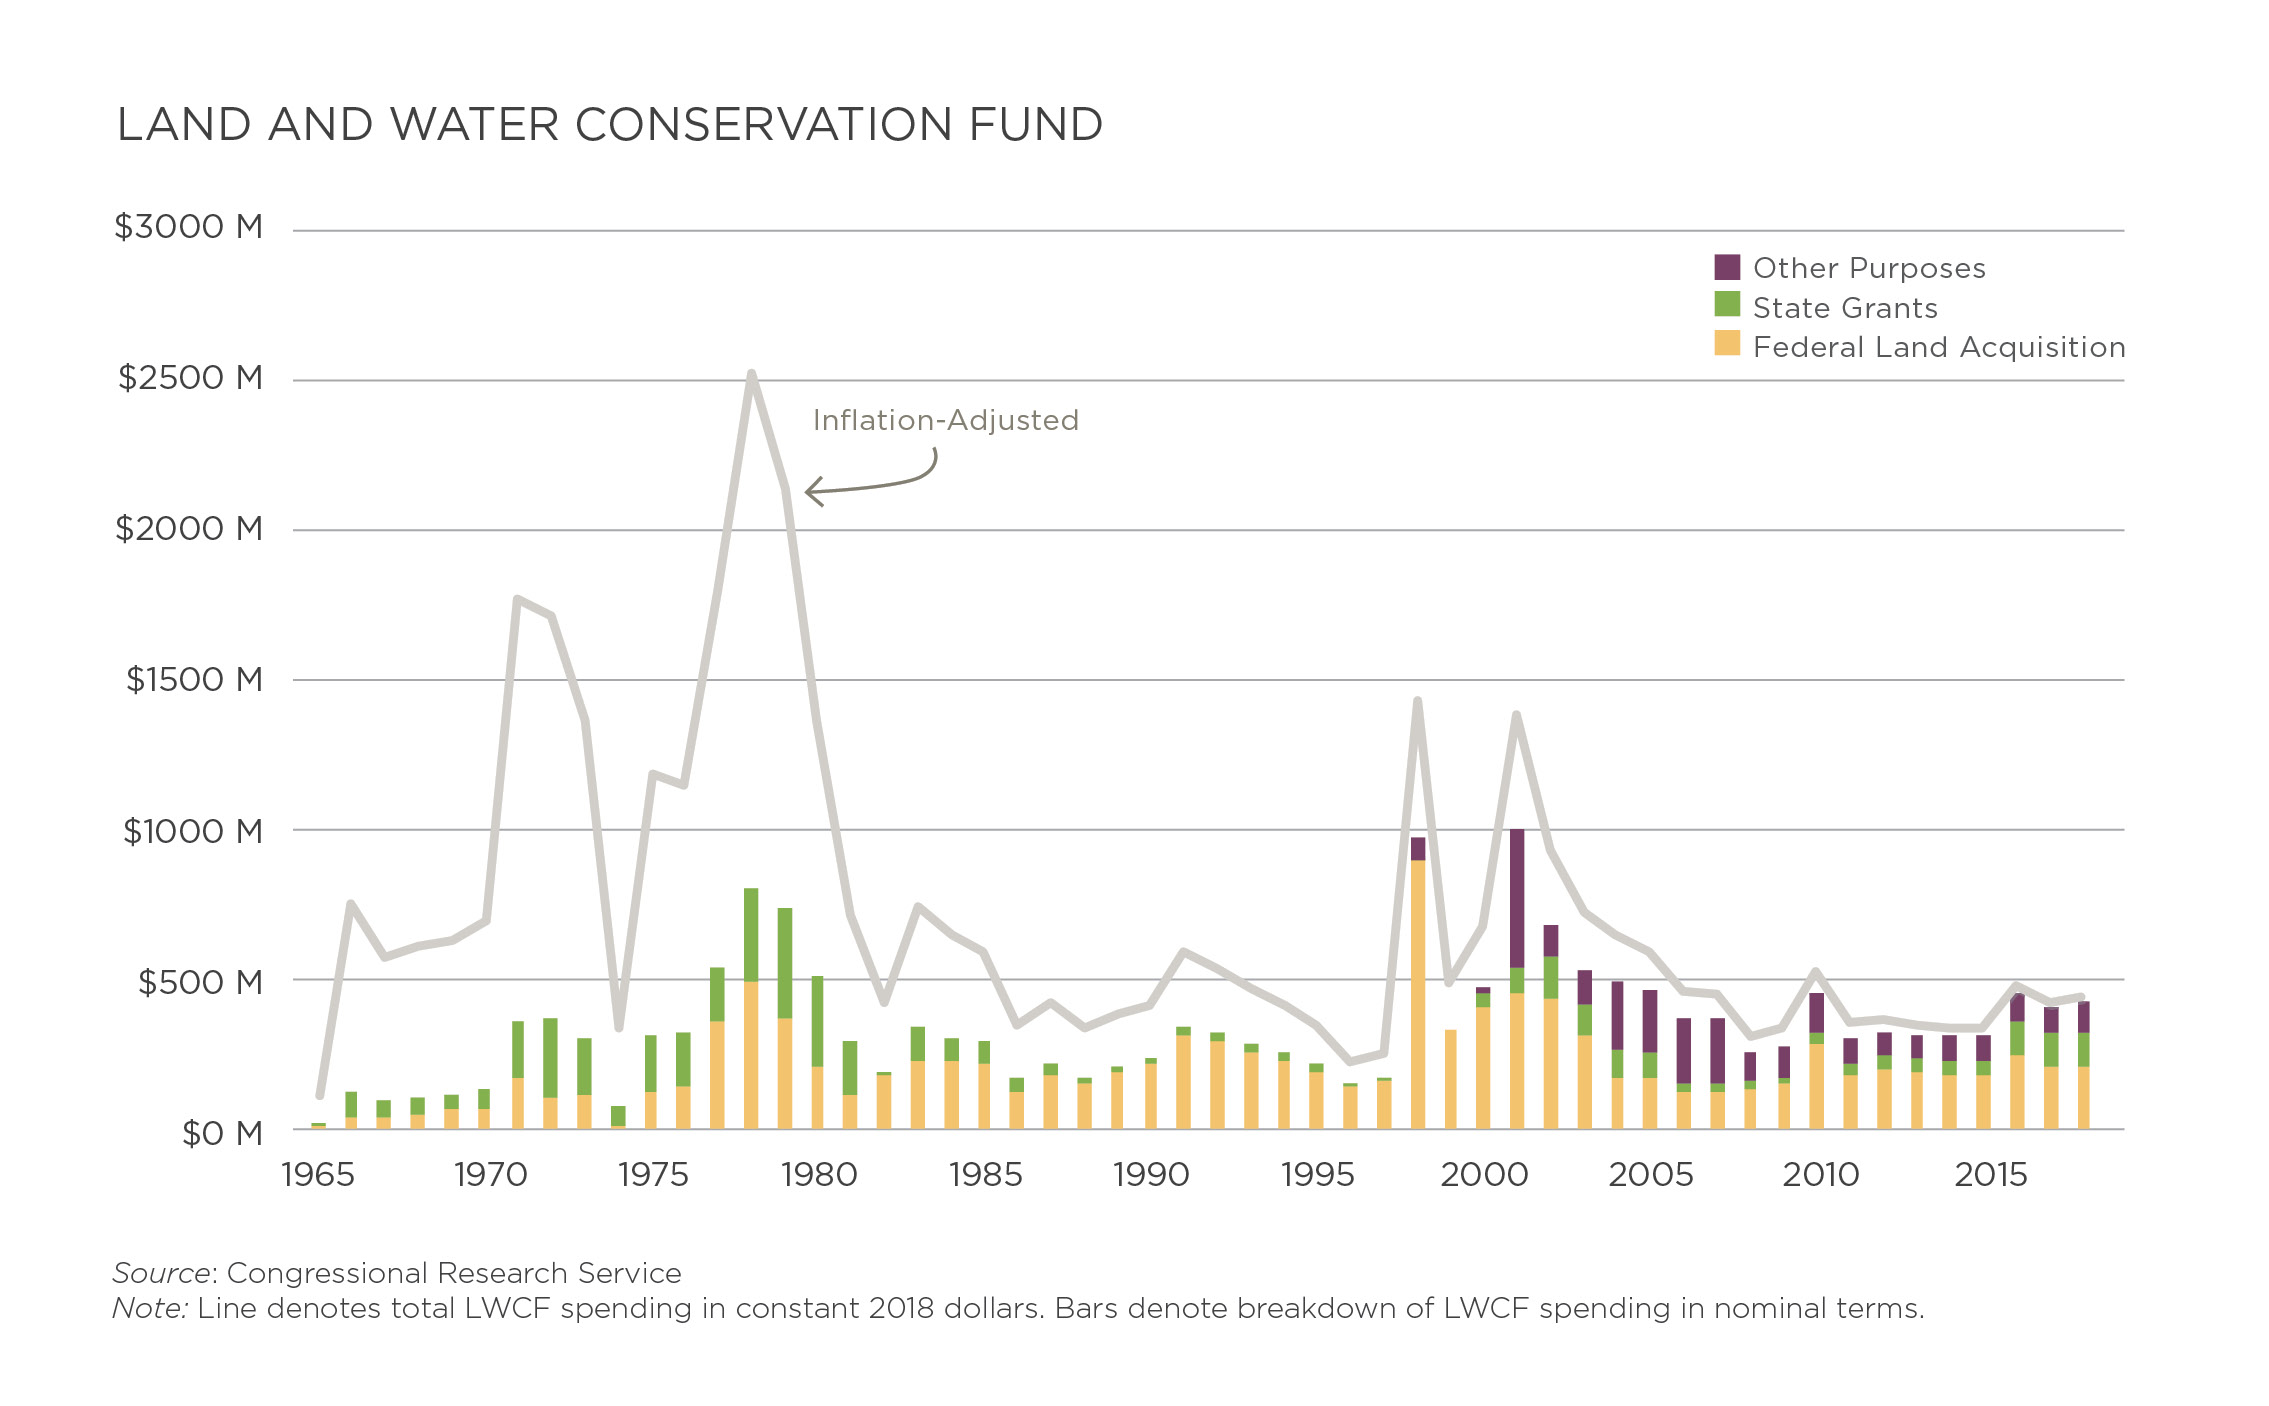
The Land and Water Conservation Fund has been a significant source of conservation and recreation funding since Congress established it in 1965. The program was created “to help preserve, develop, and ensure access to outdoor recreation facilities to strengthen the health of U.S. citizens.”[45] The fund is authorized to accrue up to $900 million annually, but the spending is not mandatory. Congress must approve any LWCF spending each year through the appropriations process. Virtually all funding for the program comes from revenue derived from offshore oil and gas leases.
Historically, the LWCF has been used for three purposes: land acquisition by federal land management agencies for outdoor recreation, grants made to states for outdoor recreation purposes, and so-called “other purposes,” which includes special requests for funding made by presidents since 1998. Since the act’s inception, the state-grants program has been a significant source of funding for state and local recreation, whether by providing means to repair or build trails on state lands, funding construction or renovations at local parks and sports facilities, or supporting other recreation-related projects. The level of annual spending approved by Congress each year under the fund has fluctuated greatly over time.
As part of a broad public lands legislation package, Congress permanently reauthorized the LWCF in 2019. The legislation did not mandate any funding under the LWCF, meaning that Congress will continue to use the annual appropriations process to approve spending under the fund. The bill did specify that for future spending approved under the program, at least 40 percent must be allocated for federal purposes and at least 40 percent must go to states.[46]
Adjusting program funding for inflation over its history shows a significant decline in real terms since the peaks of the late 1970s, representing less bang for the buck going to conservation and recreation over time. Likewise, in recent decades state grants have taken a back seat to federal land acquisition and, since 1998, to the broad “other purposes” category. In fact, states have received just 13 percent of LWCF allocations since 1998.
While the spending power of the LWCF has declined significantly over the long run due to inflation, the amount of spending actually approved by Congress has also proved to be relatively unpredictable year to year. In recent years, Congress has approved LWCF spending at roughly half of its $900 million annual accrual level. The LWCF’s unpredictable track record reflects the uncertainty of the political process inherent to congressional appropriations decisions.
State Conservation and Recreation Funding
States also provide a significant portion of government funding that supports recreation opportunities, much of which overlaps with spending on conservation. State parks and state fish and wildlife agencies are two of the most important entities devoted to recreation at the state level. In addition, some states have begun to establish dedicated offices of recreation in recent years.
State Parks
While national parks garner many headlines and feature some of the most famous landmarks and sites in the country, state parks outnumber national park units by a factor of 20 and provide countless recreation opportunities. From Florida to Alaska, more than 8,500 state park areas offer virtually any and all types of recreation, including hiking and camping, skiing, golfing, kayaking and swimming, picnicking, and simply enjoying the outdoors.[47]
After a dip in visitation around the time of the Great Recession, state parks have seen attendance grow steadily in recent years. In 2017, about 807 million people visited state parks nationwide—nearly twice as many visits as to federal parks and forests combined. The trend in operating expenditures over the past decade, however, has been a steady decline, falling from more than $3.0 billion in 2008 to about $2.5 billion today.[48]
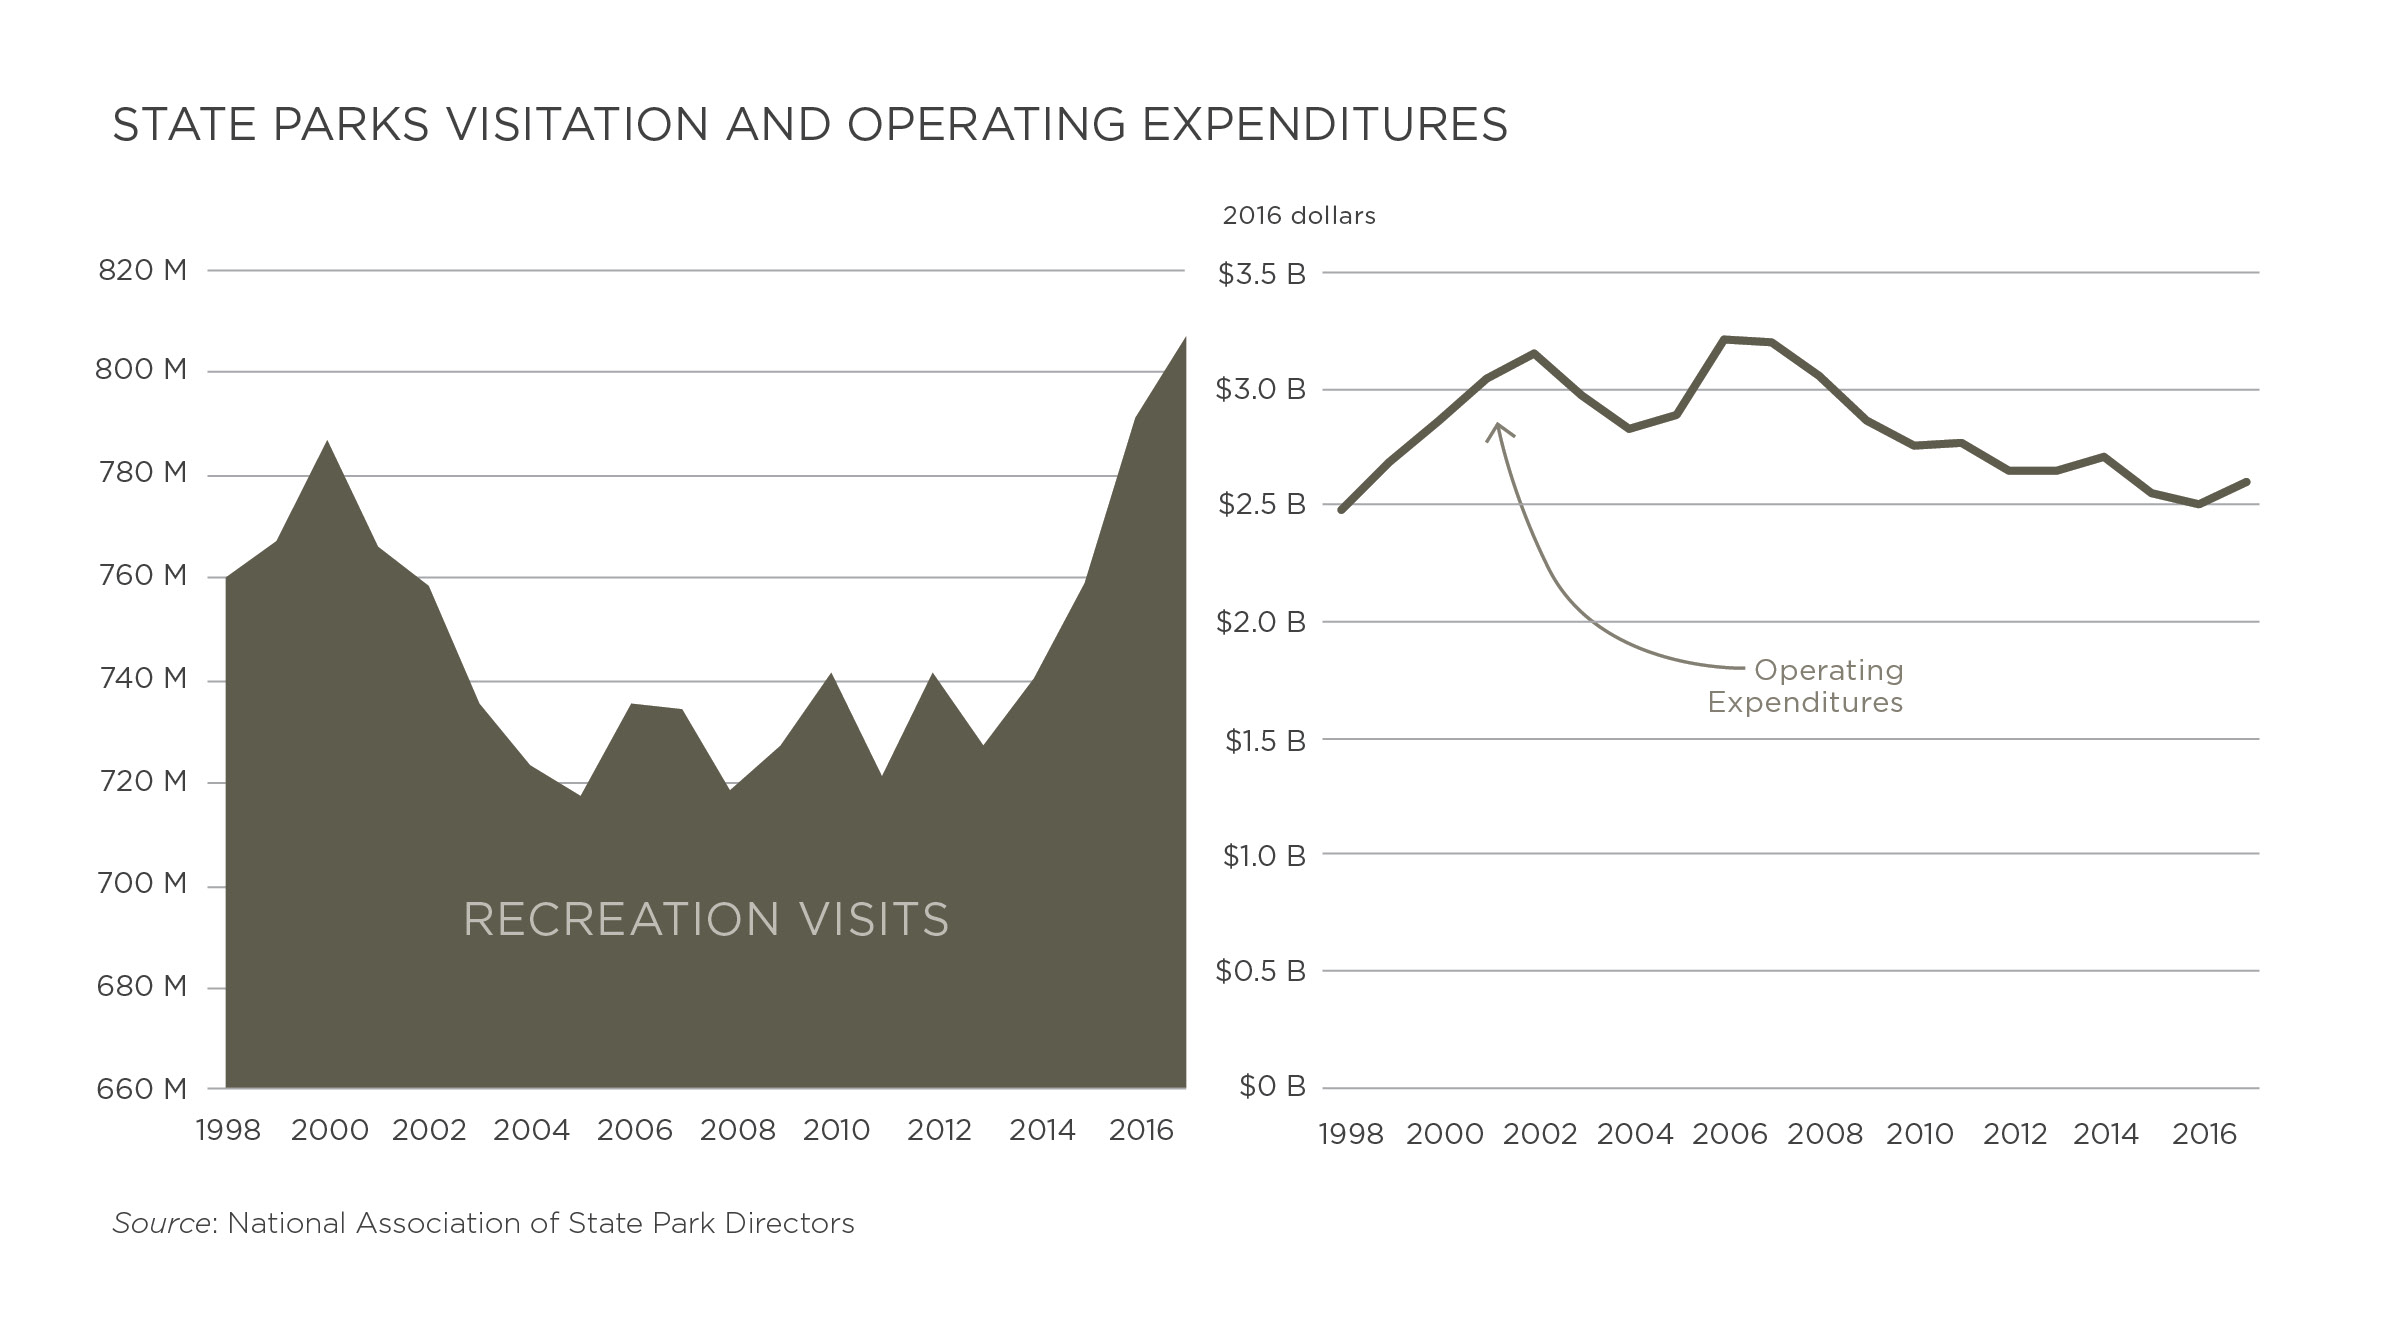
Operating expenditures include spending on all goods and services that go toward managing a state park system, meaning it can serve as a rough proxy for the amount of funding available to run parks. While there’s wide variation in the way that state park systems are funded across the country—with some extremely dependent on state general funds and others completely funded by park users—the roughly 17 percent decrease in expenditures over the past decade is evidence that funding is being squeezed in many states.[49] The upshot is that many state park systems face the same challenge as national parks—having to serve more visitors with less funding.
State Fish and Wildlife Agencies
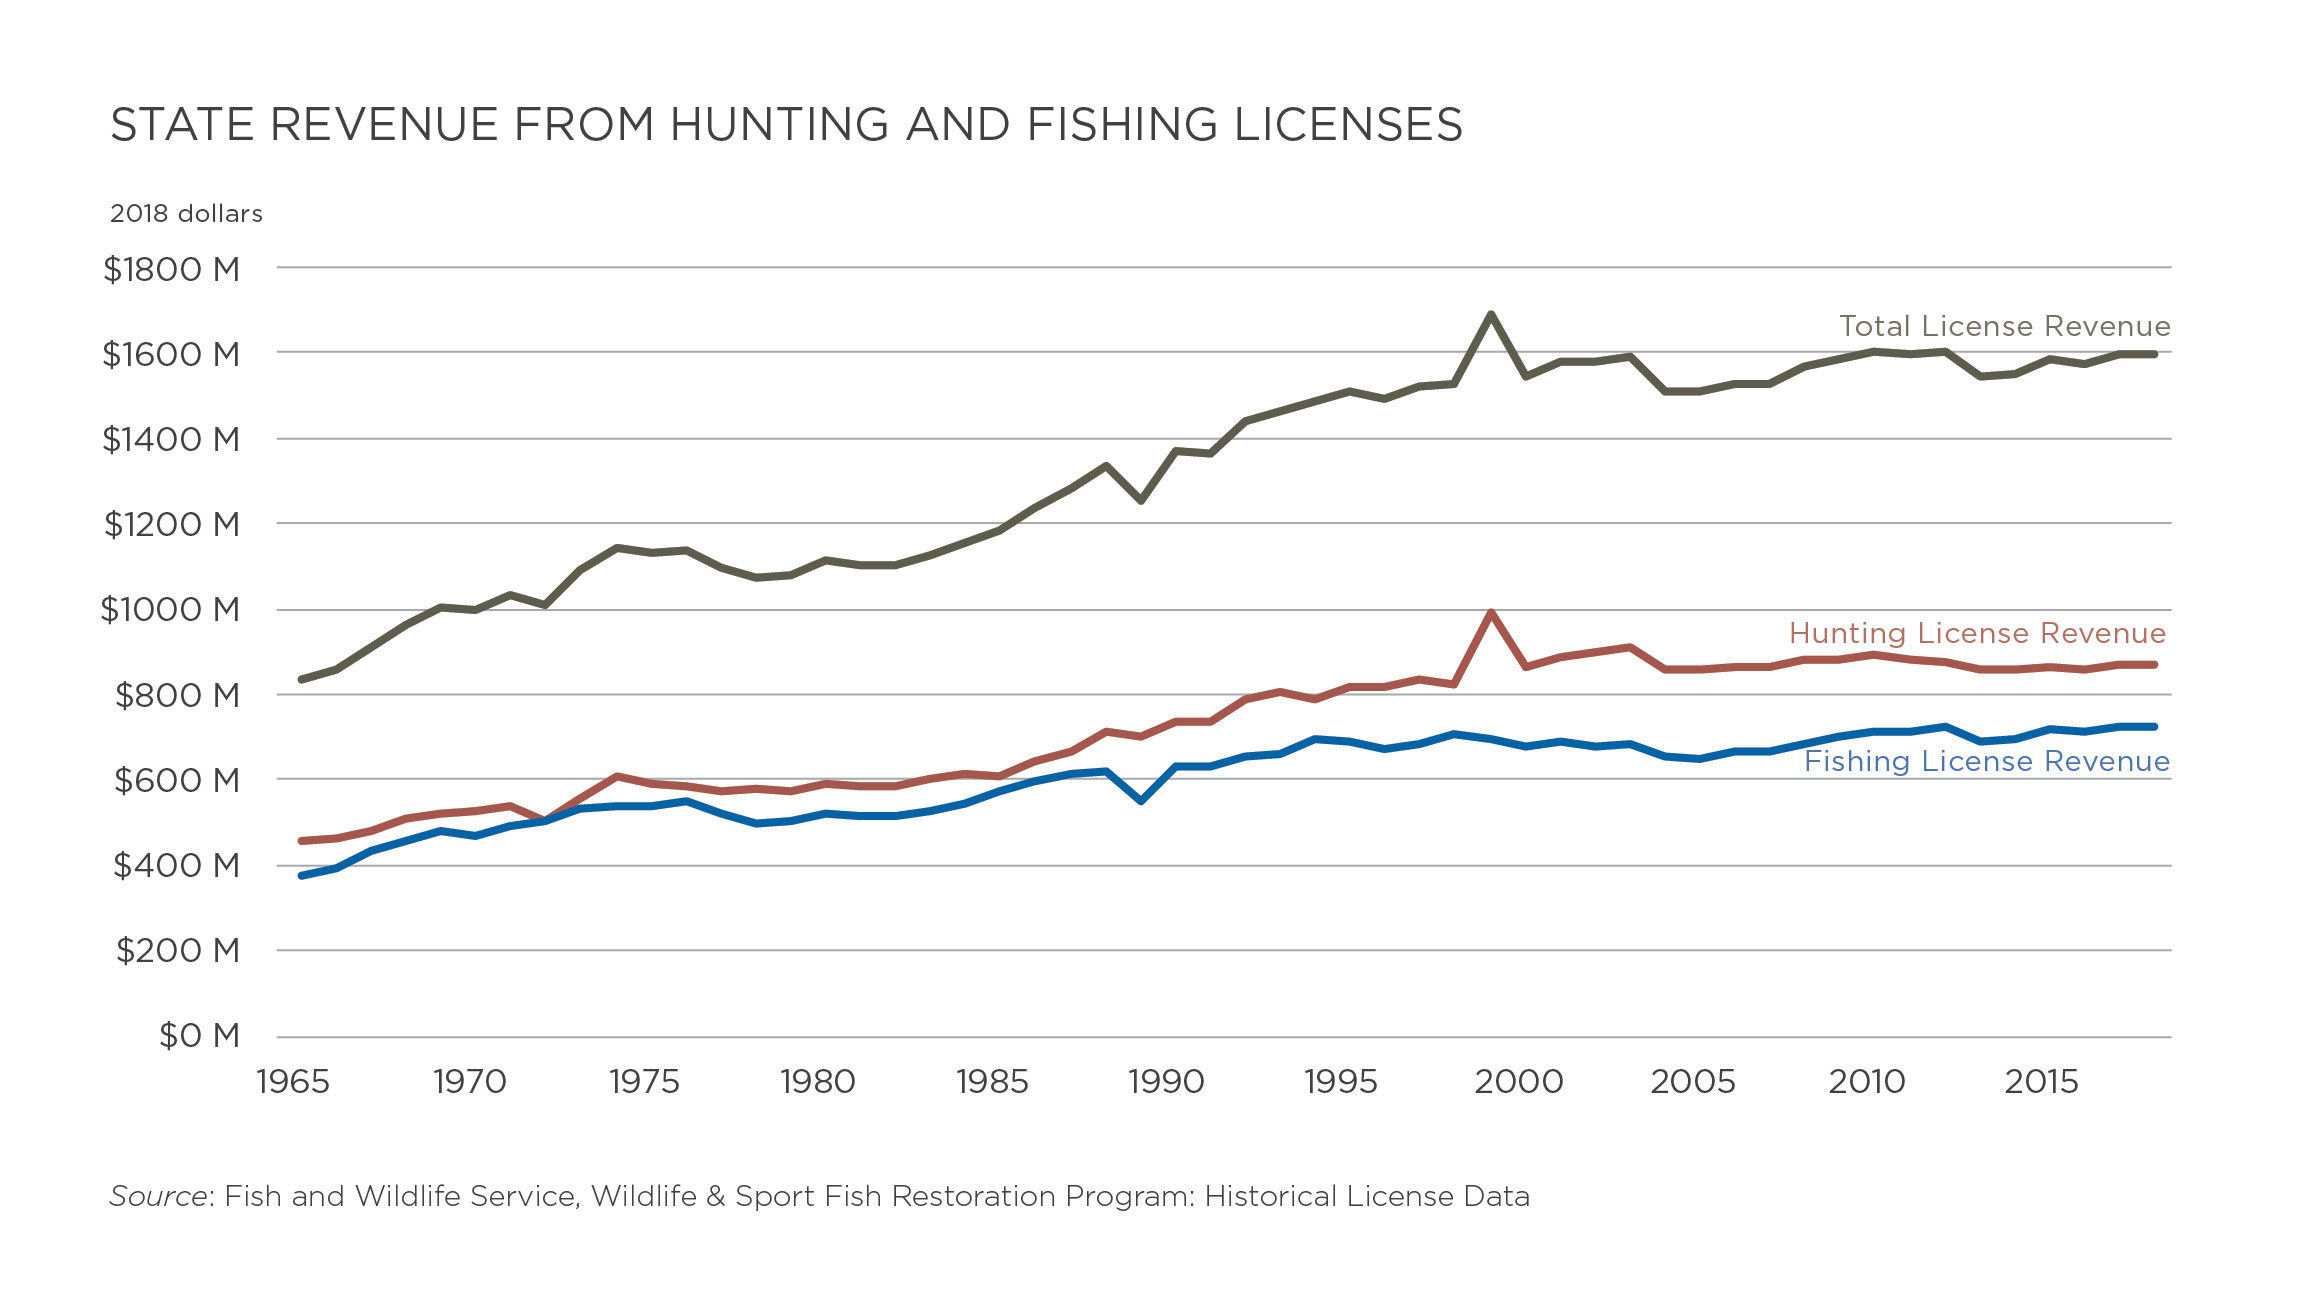
The collective budgets of state fish and wildlife agencies total roughly $5.6 billion. These agencies manage land, habitat, and wildlife within states. Nearly 60 percent of their funding comes from sources related to hunting and fishing, and the largest portion is revenue from state hunting and fishing licenses, which combine to equal about $1.6 billion.[50]
Collectively, these agencies’ second-largest source of funding is revenue from federal excise taxes on firearms, ammunition, fishing tackle, and related items. These funds are distributed by the U.S. Fish and Wildlife Service through the Wildlife Restoration Program and the Sport Fish Restoration Program, created by the Pittman-Robertson and Dingell-Johnson Acts, respectively. In 2018, the two programs combined provided more than $1.1 billion to state fish and wildlife agencies.[51] The excise tax revenues collected by the federal government are distributed based on a formula that takes into account the number of paid license holders in a state, and generally, grants under the program require states to match federal funding at a ratio of one to three.[52]
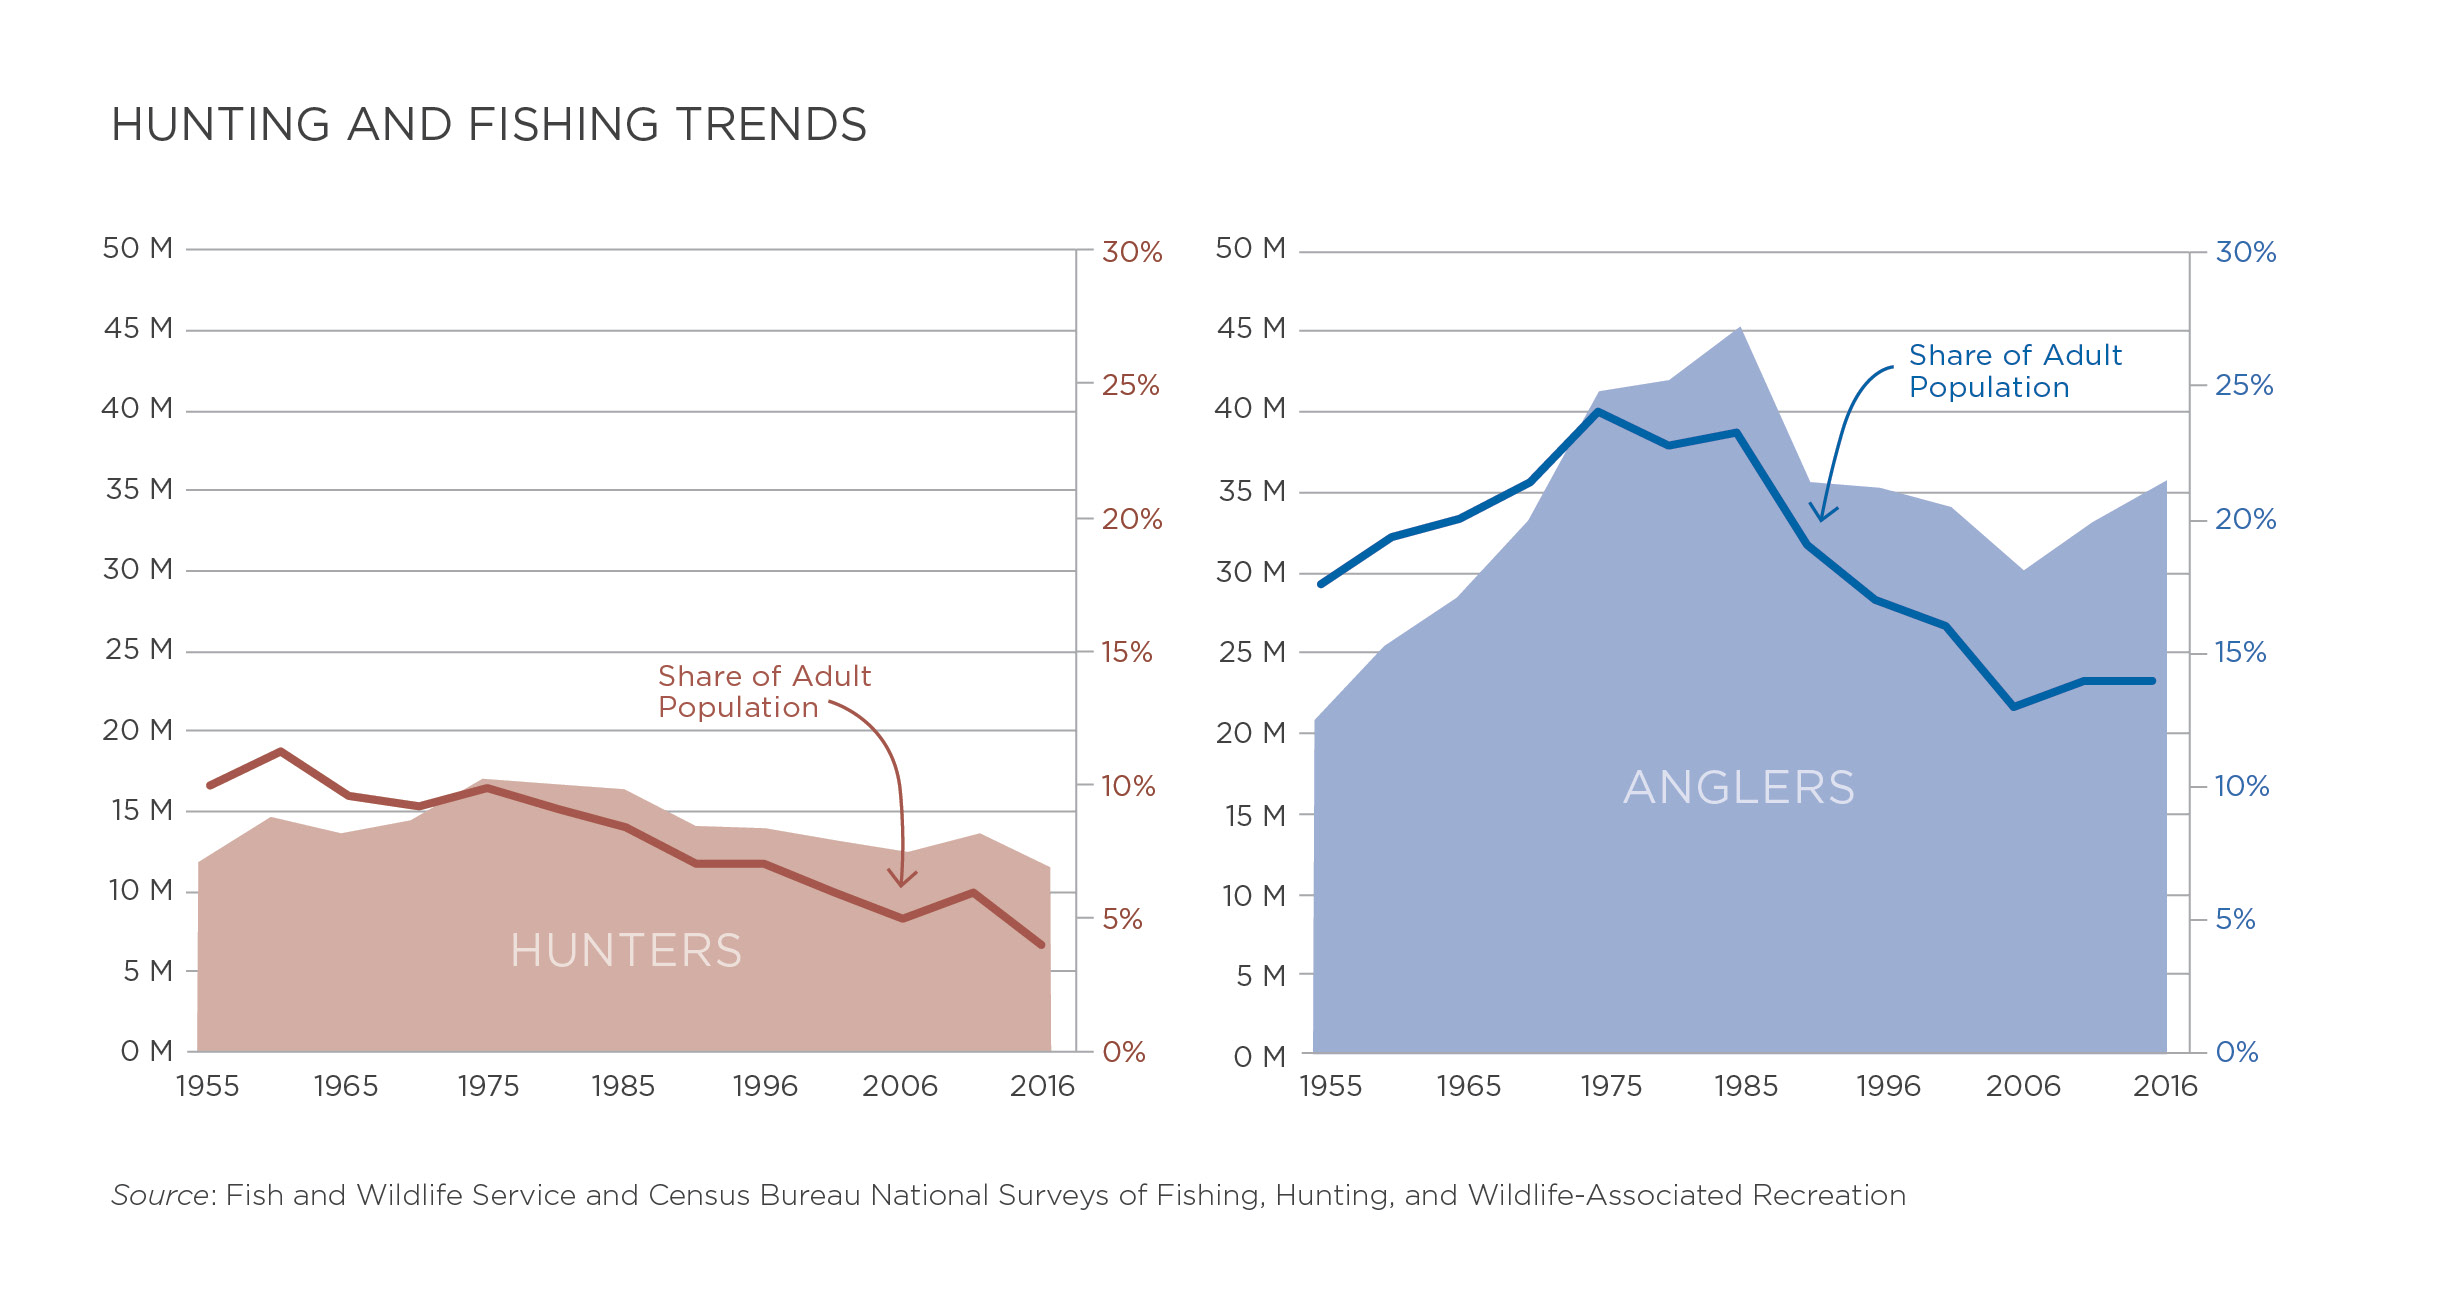
The reliance on hunting and fishing for state funding has become cause for concern given long-term trends of those activities. The share of the adult population that are hunters peaked around 1960 at about 11 percent. That participation rate had fallen to 4 percent by 2016, or about 11 million hunters, a decrease of more than 2 million hunters over the previous five years. When it comes to fishing, participation peaked in 1975 at about 24 percent of the adult population. That rate had fallen to 14 percent by 2016, or about 36 million anglers.[53]
These declines in participation have thus far not been reflected in the relatively stable streams of revenue that come from state hunting and fishing licenses. Similarly, revenues from the excise taxes established by Pittman-Robertson and Dingell-Johnson have either remained stable or increased in recent years.
It’s possible that states have become more adept at pricing hunting and fishing licenses in ways that have maintained agency revenues—such as charging more for out-of-state licenses and tags.[54] Population growth also helps offset the decline in participation rates, making it easier for states to maintain—if not grow—their license revenues. When it comes to Pittman-Robertson and funding for the Wildlife Restoration Program, it seems plausible that recent increases have been driven largely by activities not necessarily related to hunting, including growth in handgun sales, target shooting, and gun collecting.[55] Regardless, anecdotal evidence from state agencies suggests that long-term declines in hunting and fishing have become cause for concern given the significant amount of funding historically derived from hunters and anglers.[56]
State Recreation Offices
In recent years, more and more states have sought to establish dedicated recreation offices separate from other state agencies.[57] These fledgling offices have been created in part to champion the benefits that stem from the outdoor recreation economy as well as to drive the legislative agenda of recreation interests. Relatedly, some states have tried to implement mechanisms to secure dedicated funding for recreation, whether by redirecting sales taxes on sportings goods, channeling a portion of lottery proceeds, or tapping into real estate tax revenues.[58] These strategies have had mixed success and, in many cases, still must prove their staying power—especially where they were enabled by statutes that require annual legislative appropriations—but there’s no doubt that new sources of funding dedicated to recreation would be a boon for many states.
The Future of Recreation Funding
The sources of funding covered in this report provide an overview of federal and state resources devoted to outdoor recreation on public lands. Together, they also illuminate some of the current and future challenges of funding outdoor recreation at local, state, and federal levels.
Recent trends suggest that much of the recreation funding available to federal land management agencies has either stagnated or declined in real terms, even as visitation to many federal lands has been increasing over the long term. As a result, funding shortfalls for maintenance and other needs are substantial and growing. The Land and Water Conservation Fund remains a significant source of funds for federal- and state-level recreation projects, yet its funding levels have proven to be unpredictable year-to-year. Trends in hunting and fishing participation suggest concern for the future of funding sources tied to those activities.
Comparing the long-term trends of three funding streams reveals several important truths about historical recreation funding. After adjusting for inflation, state revenues from hunting and fishing licenses have proven to be remarkably stable over time. State licenses have not only been a significant source of funding for more than half a century, but as a point of comparison, the roughly $1.6 billion in revenue that they yielded in 2018 was also nearly four times larger than the $425 million appropriated from the Land and Water Conservation Fund last year.
Likewise, state funding derived from federal excise taxes on equipment for hunting, shooting, fishing, and boating have proven relatively consistent and substantial as well. These sources provided more than $1.1 billion to states in 2018.
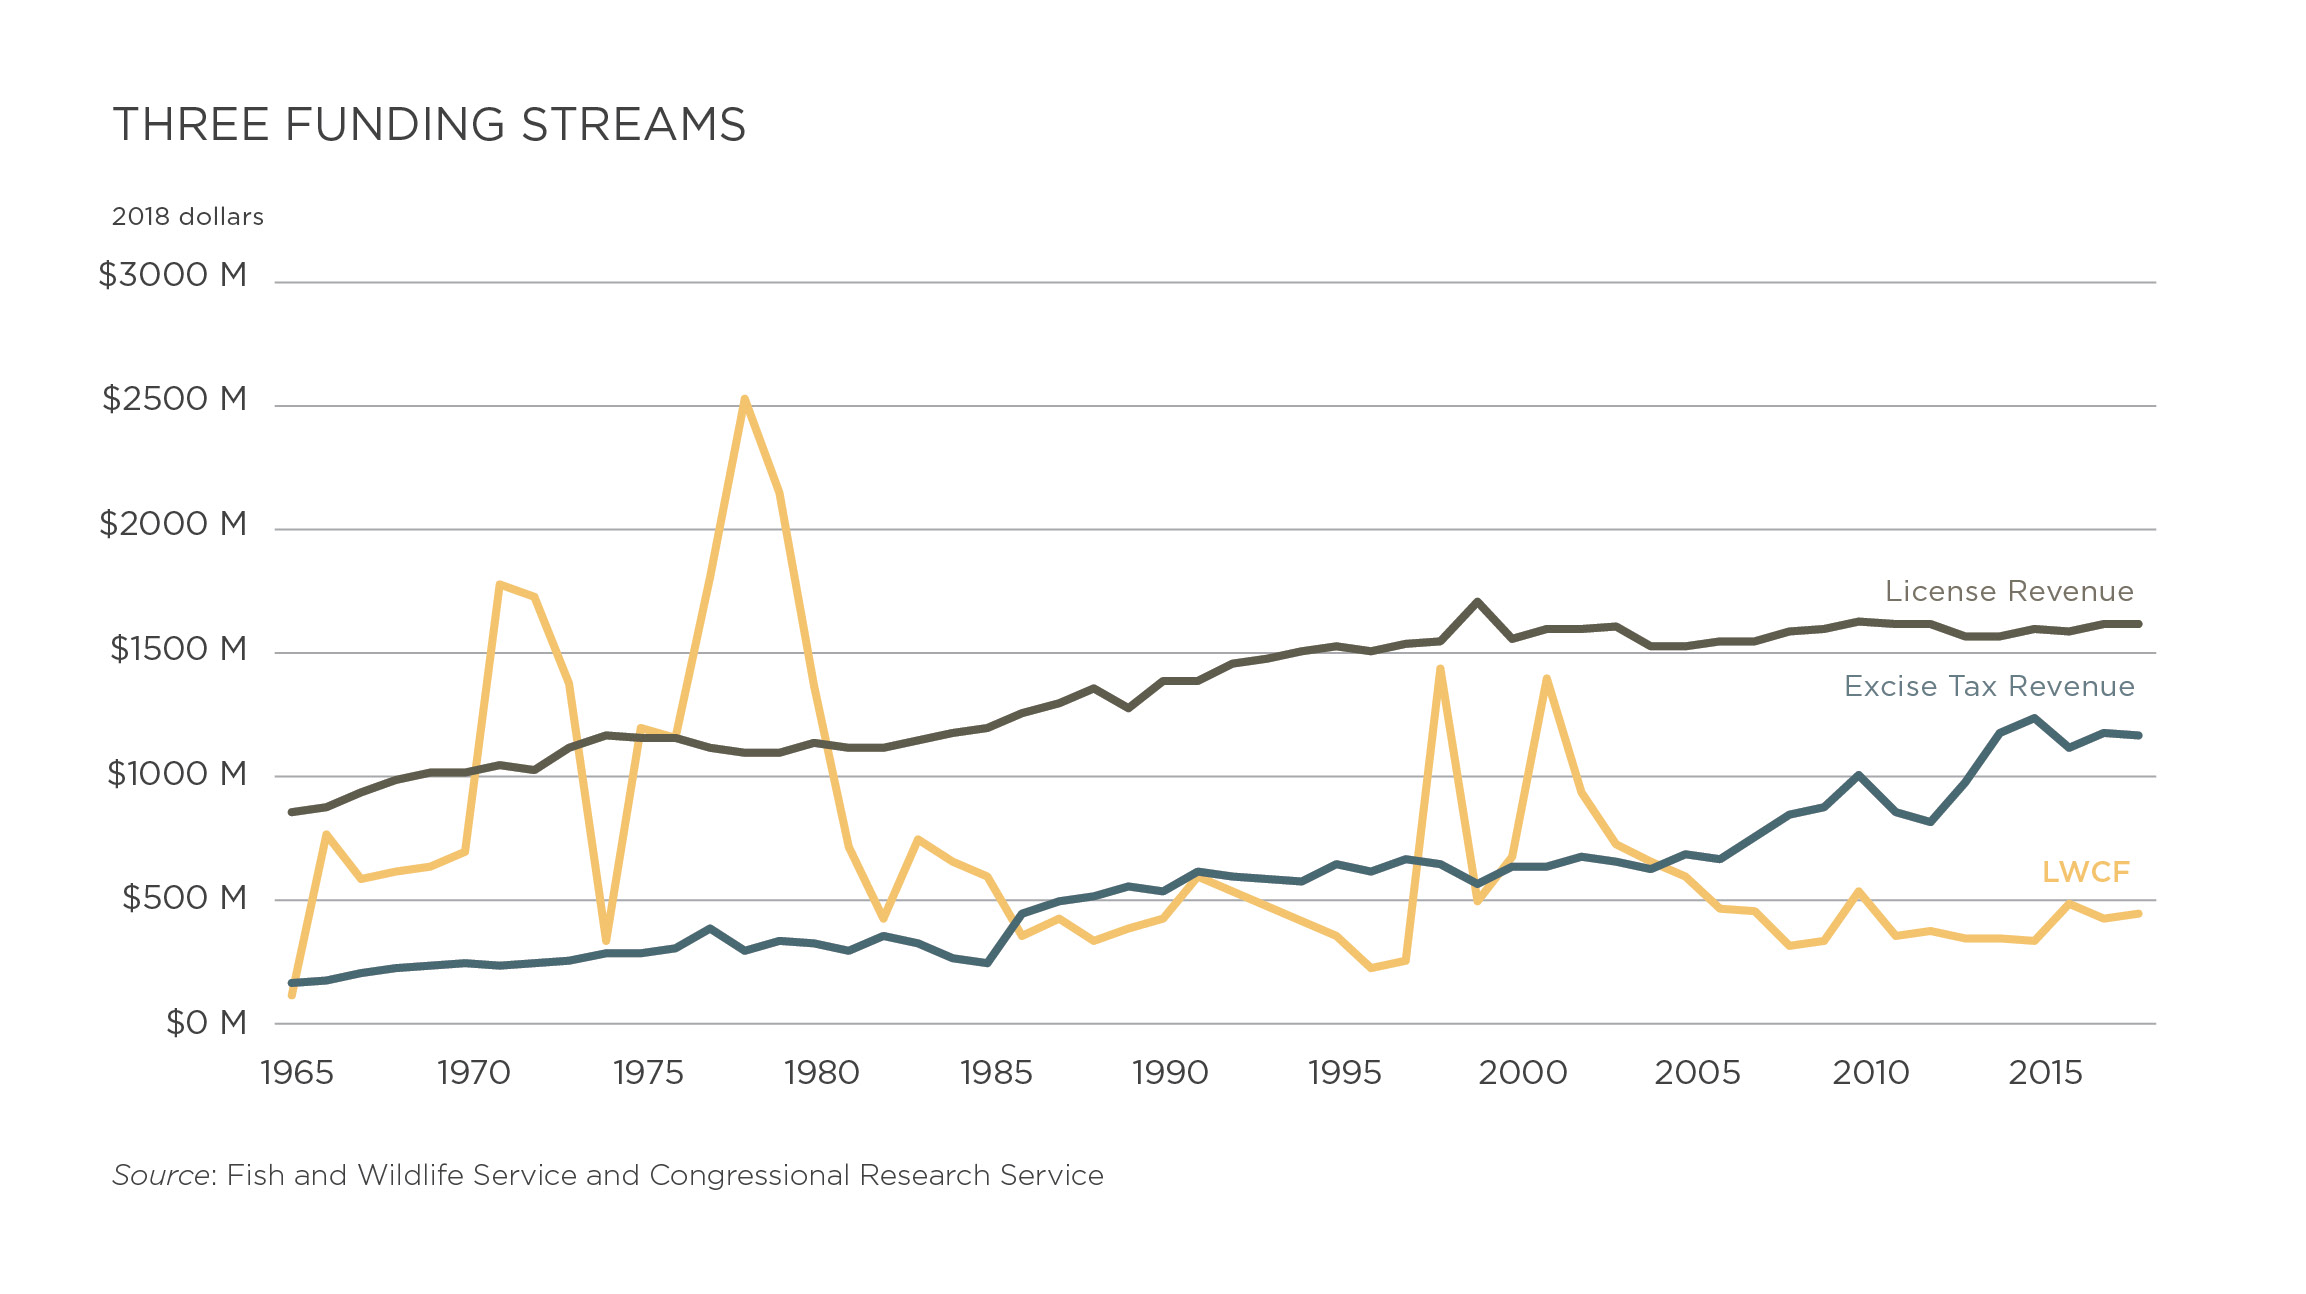
By contrast, the Land and Water Conservation Fund has proven to be a much less stable funding source. It’s clear that the fund today is yielding much less conservation and recreation—at least as measured by level of inflation-adjusted funding—than it has over much of its history. In fiscal year 1980, for instance, $509 million was appropriated under the LWCF, or roughly 17 percent more than the $425 million that was appropriated in 2018. Yet in real terms, the 1980 appropriation had more than three times the purchasing power of the 2018 one—roughly $1.3 billion compared to $425 million.[59] Clearly, the LWCF was getting a lot more bang for its conservation and recreation buck in past decades. By contrast, revenues from licenses and excise taxes are steady or even growing in real terms.
Furthermore, the ups and downs of the LWCF record even over recent decades could be interpreted as par for the course given the way the program was constructed. The uncertainty and partisanship inherent to the congressional appropriations process means that the federal and state agencies that partially rely on the fund never know how much will be approved from year to year. The funding ultimately depends on factors almost wholly unrelated to outdoor recreation, like the overall political climate, partisan priorities for government spending, and who happens to be in the White House or chair the House Natural Resources Committee.
There’s an undeniable contrast between the historical record of funding from the LWCF and the two state sources that are either directly or indirectly tied to user demand for recreation. State license revenues and proceeds from federal excise taxes have proven much more reliable and significant sources of funding over time. Furthermore, the fact that these sources are tied to recreationists helps ensure that the funds promote responsible stewardship of the public lands that serve as some of our greatest recreation assets. The incentive structure created by such funding mechanisms has clear advantages. The funds are dedicated to conservation and recreation and therefore, unlike many other public revenues, cannot be siphoned away to the U.S. Treasury and diverted to other purposes. The programs also have a clear constituency, and the accounts have proven resistant to being raided for other purposes.
The good news for Americans who enjoy recreating on public lands is that demand for outdoor recreation is healthy and potentially growing. If the enthusiasm for enjoying public lands can be better channeled into user-funded mechanisms that support the maintenance and improvement of them, then outdoor recreationists of all stripes would have much to gain.
A note on charts and data sources:
Unless otherwise noted, government spending figures within this report are for fiscal years and are adjusted for inflation using the GDP Chained Price Index from the White House Office of Management and Budget, Historical Tables, Table 10.1, “Gross Domestic Product and Deflators Used in the Historical Tables.”
[1] “Outdoor Recreation Satellite Account: Updated Statistics for 2012-2016.” Bureau of Economic Analysis. September 20, 2018.
[2] “Outdoor Recreation Satellite Account, Prototype Estimates, 2012-2016.” Bureau of Economic Analysis. February 14, 2018.
[3] “Outdoor Participation Report 2018.” Outdoor Industry Association. July 17, 2018.
[4] “The Outdoor Recreation Economy,” p. 3. Outdoor Industry Association. 2017.
[5] The Bureau of Economic Analysis estimates that gross spending on outdoor recreation by all levels of government exceeded $42 billion in 2016. State and local governments accounted for nearly $38 billion, or 90 percent of total spending. Clearly, states and local communities have taken the lead in meeting their recreational demands, which often occurs through ballot initiatives. “Outdoor Recreation Satellite Account: Updated Statistics for 2012-2016.” Bureau of Economic Analysis. September 20, 2018.
[6] For more background, see “Focus on Function 300: Natural Resources and Environment.” House Budget Committee Democratic Staff. January 31, 2018.
[7] “A Glossary of Terms Used in the Federal Budget Process.” Government Accountability Office. September 2005.
[8] Historically, Subfunction 303 has accounted for the smallest portion of Function 300. The other subfunctions include Water Resources (301), Conservation and Land Management (302), Pollution Control and Abatement (304), and Other Natural Resources (306). “Discretionary Budget Authority by Subfunction: An Overview.” Congressional Research Service Report R41726. December 16, 2016.
[9] The Bureau of Reclamation, also housed within the Interior Department, provides many recreation opportunities as well, although its mission to “manage, develop, and protect water and related resources in an environmentally and economically sound manner in the interest of the American public” is less focused on recreation than the four federal agencies examined in this report. Reclamation oversees 187 developed recreation sites that receive 24 million visits annually. The majority of those sites are managed by either concessionaires or another federal agency. For more background, see Bureau of Reclamation: Recreation Overview. Accessed April 8, 2019.
[10] “Federal Land Ownership: Overview and Data.” Congressional Research Service Report R42346. March 3, 2017.
[11] 16 U.S.C. § 1 (1916).
[12] NPS Entering the 21st Century. Accessed April 8, 2019.
[13] Over the same period, the U.S. population grew by approximately 80 percent, according to U.S. Census Bureau data. The number of park units that report visitation grew by 128 percent over that period, increasing from 166 units to 379 units. National Park Service Visitor Use Statistics.
[14] “National Park Service visitation tops 318 million in 2018.” National Park Service. March 5, 2019.
[15] Discretionary appropriations data come from National Park Service Budget Justifications. Maintenance appropriations data come from the Government Accountability Office report, “National Park Service: Process Exists for Prioritizing Asset Maintenance Decisions, But Evaluation Could Improve Efforts.” Adjustments for inflation for appropriations use the GDP Chained Price Index. Deferred maintenance estimates are compiled from National Park Service Asset Inventories, Congressional Research Service reports, and Government Accountability Office reports. For fiscal years in which a range of estimates are reported for deferred maintenance, the average is used. Adjustments for inflation for deferred maintenance use annual indexes from the Bureau of Economic Analysis Table 3.9.4, “Price Indexes for Government Consumption Expenditures and Gross Investment,” for nondefense structures.
[16] Deferred maintenance is defined as maintenance of assets “that was not performed when it should have been and is delayed for a future period.” Park units that are over 40 years old account for more than 90 percent of the deferred maintenance backlog. In 2009, an additional $750 million from the American Recovery and Reinvestment Act was devoted to maintenance in parks. For more, see “National Park Service: Process Exists for Prioritizing Asset Maintenance Decisions, But Evaluation Could Improve Efforts.” Government Accountability Office. December 2016.
[17] “NPS Asset Inventory Summary,” Fiscal Year 2018. National Park Service. September 30, 2018. Many factors affect the amount of deferred maintenance reported over time, including funding levels, economic conditions, and estimation methodology. As the Congressional Research Service notes: “Methods for assessing the condition of assets and estimating deferred maintenance have changed over the past decade. As a result, it is unclear what portion of the change in deferred maintenance estimates is due to the addition of maintenance work that was not done on time and what portion may be due to changes in methods of assessing and estimating deferred maintenance.” “Deferred Maintenance of Federal Land Management Agencies: FY2007-FY2016 Estimates and Issues,” p. 8. Congressional Research Service Report R43997. April 25, 2017.
[18] “2015 Status of the Nation’s Highways, Bridges, and Transit: Conditions & Performance.” Chapter 12: Transportation Serving Federal and Tribal Lands. Department of Transportation.
[19] The Congressional Research Service notes that “road and bridge improvements are largely funded by allocations from the Department of Transportation.” “National Park Service Appropriations: Ten-Year Trends,” p. 7. Congressional Research Service Report R42757. July 10, 2018.
[20] “Prepared Statement before the U.S. Senate Committee on Energy and Natural Resources Subcommittee on National Parks hearing on S. 3172, the Restore Our Parks Act.” Holly Fretwell. July 11, 2018.
[21] While one figure is an annual flow (annual discretionary appropriations) and the other is a stock accumulated over years (trails deferred maintenance), the comparison provides a sense of the magnitude of repairs needed across the park system. “NPS Asset Inventory Summary by Park,” Fiscal Year 2018. National Park Service. September 30, 2018.
[22] “Federal Land Ownership: Overview and Data.” Congressional Research Service Report R42346. March 3, 2017.
[23] “Federal Lands Recreation Enhancement Act: Overview and Issues.” Congressional Research Service Report IF10151. October 31, 2018.
[24] “Forest Service Deferred Maintenance.” U.S. Department of Agriculture, Office of Inspector General. May 2017.
[25] “National Visitor Use Monitoring Survey Results: National Summary Report 2016.” U.S. Forest Service.
[26] “Budget Justification FY2020,” p. 58. U.S. Department of Agriculture, Forest Service: Recreation, Heritage, and Wilderness.
[27] “Budget Justification FY2020.” Forest Service: Recreation, Heritage, and Wilderness.
[28] “Federal Land Ownership: Overview and Data.” Congressional Research Service Report R42346. March 3, 2017.
[29] “Deferred Maintenance of Federal Land Management Agencies: FY2007-FY2016 Estimates and Issues.” Congressional Research Service Report R43997. April 25, 2017.
[30] “Federal Lands Recreation Enhancement Act: Overview and Issues.” Congressional Research Service Report IF10151. October 31, 2018; “Public Land Statistics 2017.” Bureau of Land Management. June 2018.
[31] “Budget Justification FY2020.” Bureau of Land Management: Recreation Management.
[32] “Federal Land Ownership: Overview and Data.” Congressional Research Service Report R42346. March 3, 2017.
[33] “Federal Lands Recreation Enhancement Act: Overview and Issues.” Congressional Research Service Report IF10151. October 31, 2018.
[34] “Deferred Maintenance of Federal Land Management Agencies: FY2007-FY2016 Estimates and Issues.” Congressional Research Service Report R43997. April 25, 2017.
[35] Wildlife and Sport Fish Restoration Program. U.S. Fish and Wildlife Service. Accessed April 8, 2019.
[36] “Wildlife and Sport Fish Restoration Program.” U.S. Fish and Wildlife Service. October 2014.
[37] “Secretary Zinke Announces More Than $1.1 Billion for Sportsmen & Conservation.” U.S. Department of the Interior. March 20, 2018. For data on funding for the Wildlife and Sport Fish Restoration Program, see Apportionments/Funding Index, Wildlife and Sport Fish Restoration Program. U.S. Fish and Wildlife Service. Accessed April 8, 2019.
[38] 16 U.S.C. §6802 (2004).
[39] “Federal Lands Recreation Enhancement Act: Overview and Issues.” Congressional Research Service Report IF10151. October 31, 2018; “National Park Service: Revenues from Fees and Donations Increased, But Some Enhancements Are Needed to Continue This Trend.” Government Accountability Office. December 2015.
[40] “National Park Service: Fiscal Year 2020 Budget Justifications,” p. Overview-32.
[41] “Yellowstone Forever Grants $5.9 Million to Yellowstone National Park.” June 19, 2018.
[42] Trails Forever Program. National Park Service: Great Smoky Mountains National Park. Accessed April 8, 2019.
[43] “National Park Service: Fiscal Year 2020 Budget Justifications,” p. Overview-32.
[44] Includes both discretionary and mandatory budget authority. Total budget authority in FY2018 was $4.165 billion. “National Park Service: Fiscal Year 2020 Budget Justifications,” p. Overview-2 and p. Overview-32.
[45] “Land and Water Conservation Fund: Overview, Funding History, and Issues,” p. 2. Congressional Research Service Report RL33531. August 17, 2018.
[46] “John D. Dingell, Jr. Conservation, Management, and Recreation Act,” Section 3001. Public Law 116-9. March 12, 2019.
[47] State Park Facts. National Association of State Park Directors. Accessed April 8, 2019.
[48] Figures are in 2016 dollars and come from “2017 Outlook Letter.” Jordan W. Smith and Yu-Fai Leung. National Association of State Park Directors.
[49] The logic is that state park systems are not voluntarily spending less on operations over time, rather, the decrease in operating expenditures is due to budget constraints. There is ample anecdotal evidence from states to support the idea that park budgets have been squeezed in recent years and that some parks have looked to become more financially self-sufficient as a result. On recent trends, see: “The State of State Parks: After Years of Budget Shortfalls, Some States Renewing Commitment to Funding Parks.” Lisa McKinney, Council of State Governments. March 28, 2016; “State Parks Find New Ways to Save, Make Money.” Rebecca Beitsch, Pew Charitable Trusts. April 14, 2016; “Struggling State Parks Seek New Ways to Survive.” Mike Maciag, Governing. December 2016; and “The Fight for Funding in America’s State Parks.” Serge Fedorowsky, Earth Island Journal. March 1, 2017. For more on state parks and self-sufficiency, see “State Parks’ Progress Toward Self-Sufficiency.” Holly Fretwell and Kimberly Frost, Property and Environment Research Center. October 2006, and “Funding Parks: Political versus Private Choices.” Holly Fretwell, Property and Environment Research Center. August 2011.
[50] For background on funding for state fish and wildlife agencies, see “The State Conservation Machine.” Association of Fish and Wildlife Agencies and the Arizona Game and Fish Department. 2017. For data on state revenue from hunting and fishing licenses, see Historical License Data, Wildlife and Sport Fish Restoration Program. U.S. Fish and Wildlife Service. Accessed April 8, 2019.
[51] “Secretary Zinke Announces More Than $1.1 Billion for Sportsmen & Conservation.” U.S. Department of the Interior. March 20, 2018. For data on funding for the Wildlife and Sport Fish Restoration Program, see Apportionments/Funding Index, Wildlife and Sport Fish Restoration Program. U.S. Fish and Wildlife Service. Accessed April 8, 2019.
[52] “Wildlife and Sport Fish Restoration Program.” U.S. Fish and Wildlife Service. October 2014.
[53] “National Survey of Fishing, Hunting, and Wildlife-Associated Recreation: 2016.” U.S. Fish and Wildlife Service and U.S. Census Bureau. October 2018.
[54] For instance, in 2018, NPR reported: “Many states have increased license fees for out-of-state hunters to compensate for the decrease in license sales …” “Decline in Hunters Threatens How U.S. Pays for Conservation.” Nathan Rott, NPR. March 20, 2018.
[55] Pittman-Robertson data show a clear increase in receipts over the past decade, including receipts from handguns. “Guns, Excise Taxes, Wildlife Restoration, and the National Firearms Act.” Congressional Research Service Report R45123. March 5, 2018.
[56] For example, see the “Conclusions” section of “The State Conservation Machine.” Association of Fish and Wildlife Agencies and the Arizona Game and Fish Department. 2017.
[57] State Offices of Outdoor Recreation. Outdoor Industry Association.
[58] “State Funding Mechanisms for Outdoor Recreation.” Outdoor Industry Association. August 2017.
[59] In 2018 dollars, adjusted for inflation using the GDP Chained Price Index.