DOWNLOAD THE FULL REPORT
Introduction
Our national parks are in trouble. Their roads, historic buildings, visitor facilities, and water and sewer systems are falling apart. The Park Service says it has a $4.5 billion backlog of construction improvements and an $800 million backlog of major maintenance.(1) Even Yellowstone Park, the crown jewel of the national park system, is crumbling. Cost estimates to fix its pothole-ridden roads run as high as $340 million (Wilkinson 1991).
What has gone wrong? “Decades of forced neglect” is the answer given in a 1995 article in U.S. News & World Report, implying that the parks haven’t received enough money from Congress (Satchell and Tharp 1995, 25-36).
But Congress hasn’t been all that stingy. Indeed, since 1980, the total budget for the National Park Service has nearly doubled, increasing from almost $700 million to about $1.3 billion.(2) From 1980 to 1995, spending on park operations grew at a healthy annual rate of 3.1 percent after adjusting for inflation, and full-time staff increased from 15,836 to 17,216 employees.(3) While spending on the agency itself increased, spending for major park repairs and renovations fell at an inflation-adjusted annual rate of 1.5 percent.(4) It appears that long-term investment in our national parks has played second fiddle to bureaucratic growth.
Could a business survive for long if most of its budget went to organizational growth rather than to ensuring the quality of its product? Certainly not. Park management continues “as is” in spite of the parks’ deterioration only because the money to operate the parks comes from taxes, not from customers. If we are to improve the condition of our parks, the incentives governing our parks must change. The goal should be to make them financially self-sufficient, supported by those who use them.
Fortunately, we are seeing signs that this is happening. Pushed by budget-conscious legislatures, sixteen state park systems now obtain at least half of their operating support from visitors, rather than taxpayers. Even national parks are testing the waters of greater user support. Congress recently authorized a three-year demonstration program that, on average, doubles entrance fees at up to a hundred parks. Those parks will get to keep nearly 40 percent of the revenue from fees.(5) Previously, they could keep only 15 percent of the revenue.
When they were established, our national parks were supposed to be self-supporting. This paper examines the prospects for actually achieving this goal with our state and national parks. Going “back to the future” will enable our parks to solve fiscal problems while protecting the resources such as wildlife habitat that make our parks such cherished treasures.
Self-Sufficiency Begins with Realistic Fees
Very simply, self-sufficiency means relying on park visitors, not Congress, for operating support. (True self-sufficiency would mean covering the costs of capital improvements, too, but self-sufficiency in operations would be an important start.) Attaining self-sufficiency will require, among other things, charging higher fees and practicing greater diligence in fee collection.
In the past, park fees have been a subject of controversy in the halls of Congress and state legislatures. But public sentiment has been changing. A 1995 nationwide survey by Colorado State University revealed that 80 percent of those surveyed did not oppose higher fees as long as all the fees went to the parks where they were collected (National Parks and Conservation Association 1995).
When it comes to realistic fees that can support our national parks, we have a long way to go. In 1995, proceeds from park recreation fees totaled $80.5 million, or about 7.5 percent of the total cost of park operations.(6) At approximately 270 million park visitors, 1995 proceeds from all 369 parks represented an anemic $0.30 per visitor.(7)
A primary reason for the low per-visitor return is the fact that over two hundred park units did not charge entrance fees, and those that did charge fees at the gate charged by the carload per week. At $10 per vehicle, a family of four could visit in Yellowstone Park for a week for $0.36 per person per day in 1996. Furthermore, entrance fees have failed to keep pace with inflation. Beginning January 1, 1997, Yellowstone’s annual vehicle pass, which provides the user unlimited visits for the year, was raised from $15 to $40. But this hefty hike did not bring the price anywhere near the $133 (in 1995 dollars) that visitors paid in 1916 (Mackintosh 1983, 2). At $75, an annual pass to visit California’s state parks is more realistic.
If national parks are to be self-sufficient, park managers must not only be allowed to charge more realistic fees, but they must be allowed to retain most of the proceeds to enhance their parks. Most of the receipts from fees go to the federal treasury instead of the parks themselves. Most national parks give up 85 percent of their proceeds to the treasury, and those in the demonstration program still give up at least 60 percent of their proceeds. Not being able to keep the lion’s share of the proceeds weakens the incentive for park managers to maximize revenue.
Indeed, a 1993 audit by the Department of Interior’s Office of Inspector General found that the Park Service collected $59 million from user fees in fiscal year 1991, but it could have collected $105 million more from entrance fees alone without raising existing fees (USDI 1993, 22). One of the chief reasons was weak fee collection. Of the 136 units authorized to collect entrance fees and retain only 15 percent of the proceeds, 131 had made inadequate collection efforts. For example, fees were collected from only half the 409,352 vehicles that entered Olympic National Park and from only 5 percent of the 356,238 vehicles that entered Cedar Breaks National Monument and Capitol Reef National Park.
Furthermore, hardly any national parks charge fees for popular activities such as hiking, nature tours, or fishing. Yet trails need upkeep, fisheries need monitoring, and interpreters have to be paid. An additional $123 million could have been collected if fees for these activities were charged, according to the audit (USDI 1993, 22).
Self-Sufficient at the Start
At first, the national parks were supposed to be self-supporting. Congressional appropriations were to be limited to initial investments in roads and visitor facilities. Ferdinand Hayden, one of the early explorers of Yellowstone, the country’s first national park, assured Congress that the park would require no appropriated funds. Yellowstone’s first superintendent, Nathaniel Langford, even suggested that toll roads be leased through the park to pay for road maintenance (McDaniel 1996, 3).
This attitude was still strong in 1916 when Congress authorized the creation of the National Park Service. Interior Secretary Franklin Lane appointed Stephen Mather to run the fourteen existing parks on a self-supporting basis. In Mather’s first report on parks to the secretary, he stated: “It has been your desire that ultimately the revenues of several parks might be sufficient to cover the costs of their administration and protection and that Congress should only be requested to appropriate funds for their improvement. It appears that at least five parks now have a proven earning capacity sufficiently large to make their operation on this basis feasible and practicable” (GAO 1982, 2). The five parks were Yellowstone, Yosemite, Mount Rainier, Sequoia and General Grant (now part of Kings Canyon/Sequoia).
By 1916, at least seven parks had seasonal auto fees, from $2 in Glacier and Mesa Verde to $10 in Yellowstone ($26 and $133 in 1995 dollars, respectively). Auto fees increased revenues, which reached over $65,000 in 1916 ($858,000 in 1995 dollars). Mather noted that “no policy of national park management has yielded more thoroughly gratifying results than that which guided the admission of motor-driven vehicles to the use of the roads of all parks” (Mather 1916, 6).
The receipts from these fees were held in a special account, accessible to the Park Service without congressional appropriation, that could be used for road maintenance, park development, and administration. Mather considered agency control of the funds important for responsible management. But the legislation that created some parks–Rocky Mountain, Mesa Verde, Crater Lake, Hawaii Volcano, and Lassen–required these parks to turn their receipts over to the federal treasury. Mather tried to persuade Congress that revenues collected at these parks should be returned to the parks, but he was unsuccessful (McDaniel 1996, 18).
Succumbing to Politics
It didn’t take long for Congress to take full control of the purse strings. In 1918, two years after the creation of the National Park Service, Congress began to require that all park fees revert to the federal treasury (Mackintosh 1983, 3). This broke the link between park revenues and park spending, and expenditures have become political footballs ever since.
In 1965, the Land and Water Conservation Fund Act was passed to help finance the establishment of more parks. The act also redirected all national park user fees from the treasury to the Land and Water Conservation Fund. Through this act and subsequent amendments, Congress dictated what fees could be charged, how much could be charged, and which parks could charge them. Throughout the 1970s and 1980s, entrance fees were minimal, and sometimes not collected at all, and camping fees were permitted only in “developed” campgrounds.
A Reversal of Sorts
A reversal of sorts began in the early 1990s. Some parks discovered the benefits of charging fees for special use permits. Unlike other revenues, these receipts could stay in the park.(8) Yellowstone, for example, began charging $5 for an annual fishing permit in 1994. The program brought in $425,000 to the park in 1995. The fee was doubled in 1996 (Billings Gazette 1996), and revenues rose to $660,000.(9) In addition, beginning in 1993, parks were allowed to keep 15 percent of fee revenues to pay for the cost of fee collection.(10)
An even more important policy change came in 1996 when Congress authorized the Recreational Fee Demonstration Program, which went into effect January 1, 1997. This gives the Park Service the authority to select up to one hundred park units (93 of which have been selected so far) to participate in a three-year fee demonstration program. Entrance fees at these parks have more than doubled, on average, and the price of annual park passes has nearly doubled.(11) Some parks initiated entrance fees for the first time, and some began charging fees for the first time for interpretive nature programs, backcountry use, boating and snowmobiling (USDI 1996).
Each unit is allowed to keep up to 80 percent of fee revenues in excess of a base amount equal to 104 percent of the amount collected in fiscal year 1995, with this amount adjusted upward by 4 percent annually. The remaining 20 percent goes to those parks most in need. The new revenues are to be used for maintenance, enhancement of facilities, resource preservation, and annual operations. The base amount is still returned to the federal treasury. (The funds are earmarked for the National Park Service, but Congress must re-appropriate them.)
While the fee demonstration program is a step in the right direction, it does not address all the obstacles that prevent popular national parks from becoming self-supporting. For one thing, it applies to only 100 out of 369 park units. Second, it allows only 80 percent of revenues above and beyond the historical base to remain inside the park. Most of the remaining amount goes to the federal treasury, lessening the impact of fees on each park’s budget. The lion’s share of park operational funding still comes from tax dollars, and thus financial control of the parks remains with Congress. Finally, the demonstration program creates no pressure to minimize operating costs.
Why Self-Sufficiency?
There are several reasons why our park systems should move toward self-sufficiency. First, self-sufficiency would give park managers an incentive to provide more services and maintain parks in good condition. Park managers who depend on visitors for funds want them to have a memorable experience that brings them back. Unhappy customers will be less likely to return.
Self-sufficiency would also encourage more realistic pricing–that is, prices that cover the cost of services–and careful attention to collecting lawful fees. In contrast, a tax-financed park offers limited service, fails to collect fees, and encourages park overuse by subsidizing goods and services.
Self-sufficiency would also give park management an incentive to balance costs and benefits. Since costs must be covered out of revenues, managers would add services that covered costs and eliminate those that didn’t. In contrast, when park operations are mostly funded by taxes, management can ignore such economic realities. In the summer of 1996, Yellowstone Park managers closed a campground to “save” money. The campground earned more than it cost to operate, but since the revenues went to the treasury, not to the park, the managers had little incentive to keep it open.
Self-sufficiency would also free park managers from a major obstacle to protecting park resources–politics. Because most national park funding is controlled by Congress, park managers must cater to politicians and special interests. Politics is making it difficult to control runaway elk populations in Yellowstone and Rocky Mountain national parks, to keep “exotic” mountain goats from eating rare plants in Olympic National Park, and to protect wildlife from snowmobile use in Yellowstone Park. Self-sufficiency would give park management the incentives and the freedom to avoid congressional meddling.
Politics, in fact, tends to keep public funding low. Parks that rely on tax revenues for operating support are at the mercy of legislatures or Congress and the mood of the taxpayer. Public spending on state park systems averaged only two-tenths of a percent of total state spending in 1994 (NASPD 1995). As taxpayers rebel against higher taxes, the outlook for growth is poor for both state and federal funding. And when public funds are appropriated, they tend to flow to bureaucratic support and not to the parks themselves.
Self-sufficiency alone, however, will not necessarily lead to the lowest possible costs. Unlike private business, government managers are not motivated to maximize “profits.” To deal with this problem, some state park systems have created incentives for government managers to find cost savings or have “contracted out” park support functions to private sector organizations that can provide services at lower cost. These actions are in addition to the move toward self-sufficiency.
The great benefit of self-sufficiency is that it is a spur to provide more services. While it is difficult to say whether a park with many services is “better” than a park with fewer services, revenues tend to grow. This indicates that the parks with more services are pleasing their customers. At the same time, we have found no evidence that greater services damage the environment of the parks; indeed, the greater flexibility and availability of funds suggest the opposite.
Lessons From State Parks
Since 1980, many state park systems have felt the pinch of fiscally tight legislatures. General tax support for state parks has risen from $619.7 million in 1980 to $637.9 million in 1994 (NASPD 1981 and 1995). This is a small increase, given that prices rose by 74 percent over this period.
As general support lagged, state park managers began to rely more on fees. In 1980, user fees collected at all state parks totaled $181.7 million, or about 17 percent of total park spending. Fourteen years later, in 1994, user fees totaled $513.2 million, or about 33 percent of total park spending (NASPD 1981 and 1995).
Sixteen park systems regularly obtain more than half their operating costs from user fees. These include New Hampshire, Alabama, Arkansas, Colorado, Kentucky, Michigan, Nebraska, Oklahoma, South Carolina, South Dakota, Tennessee, Texas, Indiana, West Virginia, Wisconsin, and Vermont. In fact, both New Hampshire and Vermont fund their entire operating budgets out of user fees.
In spite of this trend, many states still receive only a small return per visitor. As we see in Table 1, Alabama, New Hampshire, and Vermont collected more than $4 per visitor in 1994. States such as Alaska, Pennsylvania, and Wyoming, however, collected less than 27 cents per visitor, and the National Park Service collected 28 cents per visitor. One reason for these low average returns is the failure to collect an entrance fee from many day visitors. The percentage of day visitors not paying entrance fees at parks in Alaska, Pennsylvania, and Wyoming was 91, 95 and 68 percent respectively (NASPD 1995).
| Table 1 Annual Revenue per Park Visitor, 1994 |
||||
|---|---|---|---|---|
| 0-$.50 | $.51-$1.00 | $1.01-$1.50 | $1.51-$2.00 | $2.01-$5.50 |
| Hawaii .02 | New Jersey .51 | Michigan 1.01 | Delaware 1.54 | Arkansas 2.07 |
| Illinois .16 | New York .59 | Maryland 1.02 | Arizona 1.55 | Alabama 4.10 |
| Washington .18 | Wisconsin .63 | Minnesota 1.06 | Florida 1.65 | New Hampshire 4.19 |
| North Carolina .20 | Utah .63 | Oklahoma 1.07 | Louisiana 1.73 | Vermont 5.46 |
| Iowa .21 | Montana .63 | Nebraska 1.11 | West Virginia 1.82 | |
| Wyoming .21 | Virginia .63 | Georgia 1.21 | ||
| Pennsylvannia .25 | Texas .67 | Mississippi 1.23 | ||
| Oregon .26 | Colorado .71 | Kentucky 1.45 | ||
| Alaska .26 | North Dakota .74 | South Carolina 1.48 | ||
| National Park Service .28 | New Mexico .74 | |||
| Nevada .29 | Tennessee .74 | |||
| Ohio .31 | California .85 | |||
| Missouri .31 | Maine .87 | |||
| Kansas .39 | South Dakota .88 | |||
| Massachusetts.40 | Indiana .89 | |||
| Connecticut .47 | Idaho .93 | |||
| Rhode Island .96 | ||||
| Note: For each park system, total park-generated revenue was divided by annual visitation. Source: Calculated from NASPD (1995). |
A more detailed look at several representative state park systems sheds additional light on how states finance their state parks. The four states listed in Table 2–Texas, New Hampshire, California, and Washington–have all increased revenues from park users since 1980. Texas has accomplished this by expanding visitor services and, to gain
|
Table 2 |
||
|---|---|---|
| State | 1980 | 1995 |
| Texas | $ .40 | $ .80 |
| New Hampshire | $ .61 | $4.19* |
| California | $ .26 | $ .91* |
| Washington | $ .06 | $ .19 |
|
|
|---|
| * Based on 1994 data for revenue and visitation.
Source: National Association of State Park Directors (1981), (1995), and (1996). |
additional income, it recently replacedper-vehicle entrance fees with per-person entrance fees. New Hampshire has diversified its camping fee structure to reflect different demands for campsites and has raised entrance fees. California has raised entrance and camping fees. Washington has increased fees, too, but the voters have restricted increases to camping fees. We will look more carefully at these representative park systems.
New Hampshire State Parks: A Self-Supporting Park System
We begin with New Hampshire State Parks, an agency that is legislatively mandated to be self-supporting. The system’s 89 recreational, historical, and natural sites cover nearly 75,000 acres of land, and there are more than 6,000 miles of trails. The park system attracts about 1.2 million visitors a year. It has nationally recognized natural areas, with several sites on the National Register of Natural Landmarks.
New Hampshire finances all of its nearly $5 million operating budget from fees, and has some left over for construction improvements. It was the first to implement different prices for campsites, reflecting the different levels of amenities offered and the different levels of demand for various parks. It was one of the first park systems to charge entrance fees per person instead of per vehicle. In 1996, prices for campsites ranged from $12 to $30, and entrance fees were $2.50 per adult. The annual pass to all state parks costs $35. (Children twelve years and under and resident adults over sixty-five are admitted free.)
Although New Hampshire has a long history of heavy user support, mandated self-sufficiency did not come until 1991. In the midst of a growing general fund crisis, the legislature required the park system to rely solely on park-generated revenue. Park revenue had actually exceeded operating expenditures for three consecutive years prior to passage of the act, but park receipts had been handed over to the state treasury (LaPage 1995, 29). The 1991 act let receipts flow into a park fund that carries over unspent park monies from year to year. This encourages self-sufficiency because park officials know they have a reliable source of money dedicated to parks over the long term.
In addition to operations, some major maintenance and capital improvements are now being financed through park income. Allison McLain, Director of Recreation Services, calls the current backlog of park maintenance and capital projects “manageable,” averaging $333,000 per park, but growing.(12)
The system has taken other initiatives to make ends meet. It has an extensive donor program and an ever-growing system of partnerships with companies (LaPage 1995, 29). In 1992, volunteers contributed $2.8 million in labor and private funds.
An example of company partnerships is the recent agreement with PepsiCo, Inc., which has an exclusive five-year right to beverage sales in all state parks. PepsiCo won this agreement through a competitive bid process. As part of its proposal, the company promised to fund an education and awareness program for state parks. This has produced an album of songs about New Hampshire and its parks, concerts highlighting these songs, and four park activity books featuring animated Chumley Chipmunk, who also helps promote safety and environmental education in the parks. None of these would have been affordable without the partnership with PepsiCo.
Texas State Parks: Heading Towards Self Support?
With over 500,000 acres and over 24 million visitors a year, the Texas state park system is the fourth largest in the United States, after the national park system and the state park systems of Alaska and California. The system encompasses 41 state parks, 44 recreation areas, 40 historic sites, and 7 natural areas.
In 1991, the state legislature changed the rules: Beginning in 1994, there would be no general funds for operations, except for a small tax on recreational equipment sales designated for parks.
At first, prospects looked bleak. Prior to 1991, general tax funds had made up 60 percent of the operating budget of the park system (Holliday 1995, 24), and only a handful of units were operationally self-sufficient. Park officials contemplated closing a number of highly subsidized parks. However, a “partners-in-parks” program, which brought in volunteer workers and community donations totaling $1 million, staved off immediate closure.
Then the department launched a dramatically different long-term approach to running the parks. That approach has come to be known as the entrepreneurial budgeting system, or EBS. It is a financing system that provides managers at individual parks incentives to save money and raise revenue.
At the heart of the EBS is the performance agreement, essentially a contract between the park manager and the department hierarchy to meet certain performance standards, including a spending-limit goal for the upcoming year. Department officials pledge to reward the manager if he or she spends less than the spending goal. The reward is the return of all the cost savings to the park’s budget the following year in the form of an enhancement–not an offset–to the park’s budget.
The park manager also pledges to raise revenue equal to the previous year’s revenue plus .5 to 3 percent. If the park manager surpasses the revenue target, department officials pledge to return as much as 35 percent of the surplus to the park budget the following year. The park manager will be free to spend the extra money as he or she sees fit for park improvements. Twenty-five percent of the remaining surplus goes to a seed fund to help other parks initiate EBS programs, and the remaining 40 percent goes to park units of ecological value that may never attract enough visitors to be self-supporting. In this way, the program creates a safety net for less-visited parks.
The system has spawned attractive services that earn revenue. For example, visitors at Brazos Bend State Park can enjoy a two-hour nocturnal “owl prowl” for $3 per prowler. They can watch alligators from a pontoon boat for $8 per person. At South Llano River State Park, a refurbished 1951 Chevy bus (donated by the local fire department) takes visitors on wildlife safaris through the park for $3 per passenger. Huntsville State Park holds an annual canoe rendezvous, Rocky Raccoon Trail Runs, and 50- and 100-mile “fun” runs that generate between $5,500 and $7,000 annually in additional funds. Activities such as these raise revenues without detracting from natural amenities. As an added safeguard to protect the parks’ environment, regional managers must approve all customer services proposed by field personnel. Says Huntsville State Park Superintendent Wilburn Cox, “Protection of our natural resources remains our first priority.”(13)
Overall, EBS has registered financial success. During the planning stage, department officials anticipated that the program would yield $1 million in additional revenue. By fiscal year 1995, additional revenue had reached $1.1 million and cost savings totaled nearly $685,000 (King 1995, 56). Tyler State Park Superintendent Steve Powell says that the program “makes you more thrifty because you have an incentive to save.”(14) The year before EBS began, nine parks took in more revenue than they spent. After three years of operating under the program, twenty-two parks took in more money than they spent.(15)
EBS has given park managers discretionary funds to enhance park amenities and improve park facilities. Hakeem Elahi, Assistant Park Manager at Brazos Bend, says that with additional money generated under EBS, his park purchased a plant shredder that is now used to create small openings for wildlife in areas of dense vegetation. EBS money has also financed the upgrading of maintenance vehicles and equipment at Garner State Park.
As with any new system of operation, there have been growing pains. A drought year in 1996 reduced visitation far below normal levels, wiping out the funds that were supposed to reward the parks that had gained revenue in 1995. The glitch occurred because payments to parks come out of anticipated revenue from the next year, not actual earnings. To avoid such a problem in the future, payments should be paid out of actual earnings.
In addition to using the entrepreneurial budgeting system, parks have opened up their own souvenir shops, and park officials recently began operating a centralized reservation system for state parks. Both of these innovations make money. The centralized reservation system helps tourists find alternative parks or dates for camping when their first choice is filled up. It also increases park revenue by steering people toward underutilized parks. During the system’s first six months of operation, 30 percent of the reservations were made by campers whose first choice was filled, but who agreed to an alternative park or date.
The Texas parks have made steady progress toward the goal of operational self-sufficiency. Revenue hovered around $12 million annually from 1989 to 1991, but rose steadily in the next four years, reaching nearly $20 million in 1995, or two-thirds of the operating budget. Texas officials say parks can make further gains if, among other things, they are given complete control over pricing park services and facilities and over the park system’s funds, including interest earned from those funds. Currently, the legislature retains authority over both.
While trying to move the parks toward operational self-sufficiency, officials are also trying to cope with a substantial capital backlog, estimated to be as high as $185 million. The most pressing need is to modernize outdated sewage and drinking water systems, which pose potential health risks to park visitors and whose improvement will cost $50 million (Dawson 1996b). The huge backlog stems from the late 1970s and 1980s when general tax dollars and oil and gas revenues flowed into the park system. Political pressures directed the money to land acquisition rather than to needed repairs and renovations. Says one park official, “People don’t like to cut ribbons on new roofs and sewer systems” (quoted in Dawson 1996a).
To raise capital, Texas officials have turned to the park user. In May 1996, per-vehicle entrance charges (which averaged $3) were replaced with per-person entrance fees ranging from $0.50 to $5 at all parks. In addition, the annual pass to state parks was raised from $25 to $50. Officials had hoped that the new entrance fees would raise an additional $5 million to $7 million to fund park renovations (Taylor 1996, 63), but the 1996 drought reduced revenues. While the parks’ gross revenues were 7 percent greater in May 1996 than in the same month in 1995, they fell 11 percent in July when the drought was at its peak (Dawson 1996b). Officials hope that the full benefits of the new entrance fees will materialize once the drought ends.
California State Parks: Standing on the Threshold
Composed of 275 units, the California state park system is the largest state park system in the nation after Alaska’s. It is the most visited state park system, with more than 65 million visitors in 1994 (NASPD 1995). Amenities at California state parks include coastal beaches ranging from serene to rugged, expansive deserts, majestic redwoods and sequoias, and landmarks illustrating the state’s rich history.
Like many others, the California state park system is in transition. Shrinking general funds and a maintenance backlog estimated at $75 million have prompted park officials to search for ways to reduce operating costs and increase visitor revenue.
In 1996, the system’s operating budget was $180 million, but this amount was $45 million less than the system’s operating budget four years earlier, largely due to lower general fund appropriations. Park receipts increased by $15 million over this period, but the increase covered only half the loss from general funds. The 1996-97 budget for parks included a $16.4 million emergency augmentation from state general funds, with the provision that it be phased out over five years as new efforts are implemented to save money and raise revenue.
The Department of Parks and Recreation has already taken several steps to save money and raise revenue. Some fees have increased; the annual park pass went from $50 in 1990 to $75 in 1994. New partnerships with corporate sponsors and volunteer work projects have provided services for parks. A revamped state park store in Sacramento is earning money. Private contracting has reduced operating costs, and some lightly visited units have been transferred to local or nonprofit entities.
California’s parks generate substantial revenue from entrance fees, camping fees, cabin rentals, and concessions, at least in comparison with other state systems. In 1995, revenue from entrance charges, including a per-vehicle fee of $5 and the annual parks pass of $75, totaled over $26 million. Camping fees ranging from $7 to $20 for primitive sites and $12 to $25 for developed sites were the next largest source of revenue, totaling $19 million. Concession fees, averaging 7 to 8 percent of lodging and restaurant sales and 4 to 10 percent of merchandise sales, totaled nearly $8 million. All park receipts are kept in the State Parks and Recreation Fund, from which allocations are made annually by the state legislature.
Perhaps the most promising change in the California system occurred in July 1996. The department began allocating park budgets through a process that rewards local managers for generating more revenues or saving money. California’s park system has twenty-three districts. The new budget allocation program allows each park district to retain all the revenues earned from its parks above a historical base (but not to exceed $63 million for all parks). Budgeted funds not spent can be used the following year at the discretion of the district. Any shortfall in revenues will be taken from the following year’s budget. This system gives district managers incentives to save money and to earn revenue.
Still, there appear to be untapped opportunities to increase revenues. In 1994, only 30 percent of the 65 million-plus visitors went to areas that charged fees. The remaining 46 million visitors are an important potential source of revenue.
Washington State Parks: Mired in Red Ink
The Washington State Parks and Recreation Commission administers 105 developed state parks, some satellite properties, and about twenty sites held either for preservation or future park development. Together these areas constitute 232,000 acres. Recreational and educational facilities abound, with nearly 8,000 campsites and 6,000 picnic sites, 122 boat launches, 699 miles of trail, 10 environmental learning centers, 13 interpretive centers, and 17 historic sites. With so much to offer it is easy to see why the system is so popular. In 1995, over 47 million people visited Washington’s state parks (NASPD 1996). This was the fourth highest visitation among all state park systems in the nation.
Despite its popularity, Washington park system is experiencing serious financial problems. A 1994 report by the State Parks and Recreation Commission, the administering agency for Washington’s parks, said that the parks are “crumbling under the weight of recurring budget cuts, staff losses, and increasing public demands” (Washington State Parks 1994, 1). In addition to a substantial decline in onsite staff, thirty parks that were once open year-round have been closed seasonally; deferred maintenance projects now top $40 million; and during peak usage times there is a shortage of campsites.
The reasons for this distress are not hard to find. The system is funded entirely from the state general fund and is one of only ten state park systems that do not charge a day-use fee at any park. Camping and concession fees are collected, but they go into a state park fund and the legislature must reappropriate them for park use. Camping fees are significant. In 1995, they totaled nearly $8 million, accounting for 15 percent of the parks’ operating budget.
Dissatisfaction with the current funding process and recommendations for change are surfacing, albeit slowly. In its report, the commission considered a day-use fee but did not propose it, fearing a public outcry. General sentiment in the state clings to the notion that park access must remain free. This is unfortunate because down the coast, California, with nearly 20 million “fee area” visitors, generated nearly $28 million from entrance fees alone in 1994.
The commission also assumed that camping fees had reached adequate levels. In fact, however, Washington’s campsite fees are typically under half the price charged in California and several other western states.
The commission did propose that the parks be allowed to keep all user fees in an unappropriated fund, avoiding the legislative process. In July 1995, a special park fund for park-generated revenues was created, but legislative approval is still required to use these revenues. The commission also proposed increases in fees to concessionaires, river guides, and other commercial operations, and the establishment of more “friends of parks” groups to raise funds and donate volunteer work.
Recently, volunteer programs, friends’ groups, and other donors have become more active. The commission has also implemented a centralized reservation system (in coordination with Oregon) for campsites. This should increase attendance and revenue. To help with capital improvements, the 1996 legislature authorized the use of certificates of participation (essentially, bonds) for park improvements. The state treasurer, acting as broker, sold ten-year bonds at 4.5 to 5.5 percent variable interest to private investors, raising $310,000 for improved lodging and campgrounds in Fort Warden State Park. Repayment of the bonds is made with revenues earned by the new facilities.(16) However, a 1994 initiative approved by voters limits fee increases and removes entrance fees as a viable option for raising revenues. Hence, Washington’s parks still have a long way to go in addressing their funding problems.
Comparing State and National parks
The best way to illustrate the differences that stem from self-sufficiency is to compare adjacent parks that differ in their reliance on user fees. State and national parks in Texas and South Dakota provide such a one-on-one comparison.
Big Bend Ranch State Park vs. Big Bend National Park
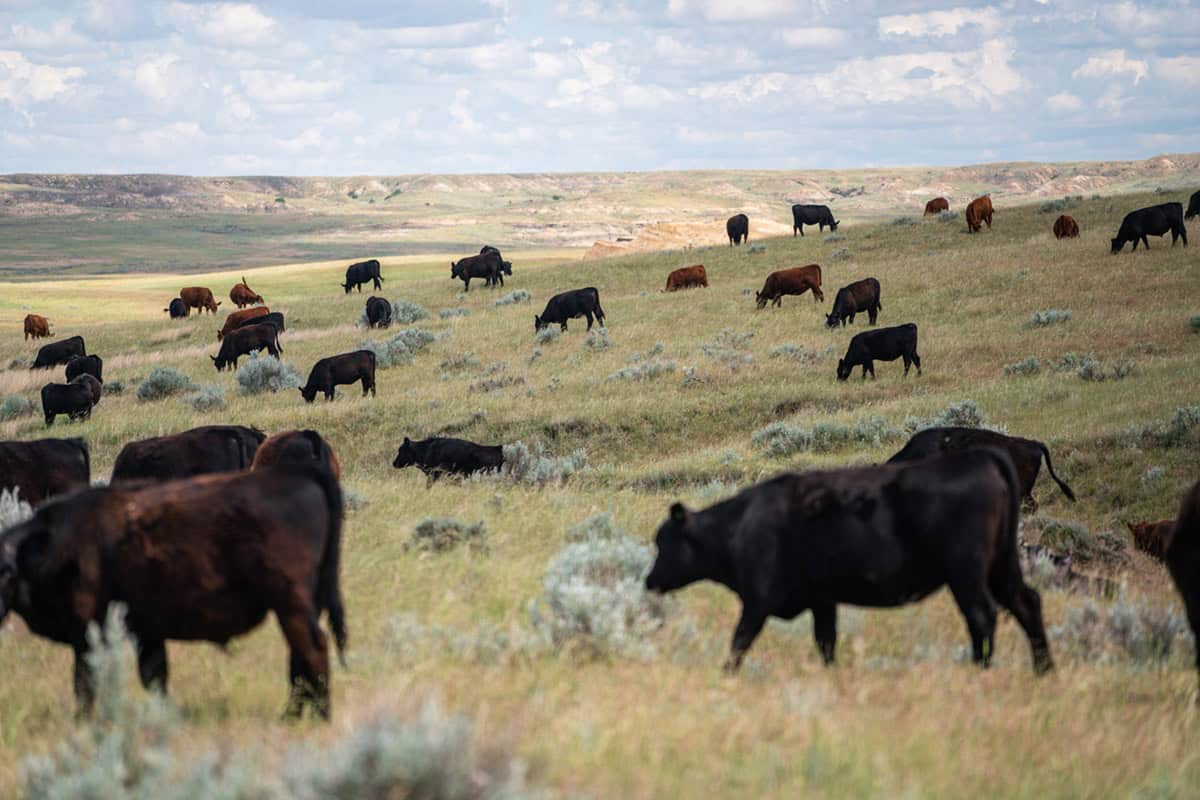
Big Bend Ranch State Park and Big Bend National Park are located next to each other in southwest Texas.(17) Both parks feature mountain, river, and desert habitats in a setting as rugged as any in the western United States. Both parks border the Rio Grande River and include huge sections of Chihuahuan Desert wilderness. Both parks are home to a rich variety of wild animal and plant species. Beaver, summer tanagers, painted buntings, vermilion flycatchers, sandpipers, and killdeer bobs reside along the Rio Grande and its flood plain. White-tailed deer, mountain lions, and peregrine falcons inhabit the mountainous regions of both parks. Roadrunners, Lloyd’s mariposa cactus, and lechuguilla, to name just a few species, occupy the desert.
At 801,163 acres, Big Bend National Park is over two-and-a-half times the size of Big Bend Ranch State Park. Established in 1935, it has been around longer and has more facilities for park visitors, providing lodging, dining, gas, groceries, showers, and laundry. It also has 194 developed camping sites complete with water, outdoor toilets, and electrical hookups, as well as an area with utility hookups for recreational vehicles.
Big Bend Ranch State Park, a former private ranch generally called “Big Bend Ranch,” became a state natural area in 1989 and a state park in October 1995. It first catered to tourists in 1991. The park has two lodging facilities, one bed-and-breakfast style and one dormitory-style, located on the edge of the park. Together they can accommodate thirty-eight visitors. Gas and groceries are available just outside the park. As of 1995, there were only sixteen campsites, all considered primitive. Five of the sixteen have pit toilets; the rest have none. Young and relatively undeveloped, Big Bend Ranch receives far fewer visitors than Big Bend National Park–56,697 visits compared with 314,209 in 1995.
With the nearest city over two hundred miles away, Big Bend Ranch and Big Bend are both considered “destination parks.” Such parks attract people who can afford to travel a considerable distance and spend a few days in or near the parks. Visitors can enjoy the same basic activities at both parks, such as hiking and wilderness backpacking, nature tours, horseback riding, camping, fishing, river rafting, and bird watching. However, most of these will cost extra at Big Bend Ranch, and there are more offerings at Big Bend Ranch than at Big Bend. There are other differences, too, in the way that the parks are maintained and in their ability to protect their natural resources.
Big Bend National Park
Hiking, birding, horseback riding, river rafting and canoeing, fishing, and swimming are free at the national park, and a few naturalist workshops are offered at no charge. Valerie Naylor, Chief of Interpretation and Visitor Services at Big Bend, says they are always trying to improve on the interpretive offerings at Big Bend, but are “limited by staff and budget.”
Maintenance in Big Bend National Park has suffered in recent years as a result of budget cuts. Periodic repair and rehabilitation of facilities are lagging and, “in some cases, have the potential to threaten public and employee health and safety” (Big Bend National Park 1996, 7). Deterioration of facilities and trails has become a major concern.
Visitors are free to roam the national park as they please. Big Bend does not have a visitor management policy to protect its natural features from human impact.
Big Bend Ranch
The state offers a wide variety of fee-based activities. Bird watching, river rafting, canoeing, hiking, fishing, horseback riding, and swimming cost an additional $3 beyond the $3 per person entrance fee. (The entrance fee is waived if the visitor has purchased the annual Texas Conservation Passport.) Overnight fees are $6 per night per person, of which $3 is the entrance fee and $3 is the activity fee.
But these basic activities are just the beginning. Three-day rock art and desert survival courses are available for $300. A three-day desert photography course is available for $450. Interpretive bus tours into the interior of the park cost $60. In addition, visitors can see the botanical desert garden and museum exhibits at the Barton Warnock Environmental Education Center near the southeast entrance or the historical site, Fort Leaton, on the west side of the park. These options cost an adult an additional $2.50 and $2.00 respectively ($1.00 per child).
One program that has generated a lot of interest is the Longhorn Cattle Drive and Campfire. For $350 and your own horse and tack, or $450 if the park provides the horse, visitors can assist park rangers as they move the small resident herd of Texas longhorns from winter to summer pasture and vice versa. The drive lasts three days and includes meals, lodging (trailside tents or cabins), and evening campfire entertainment. Visitors participate in the roundup and branding and vaccination of cattle. Offered twice a year for up to twenty participants, the cattle drive has the longest waiting list of all the activities offered in the park.
Big Bend Ranch’s housing and facilities were in pretty good shape when the state purchased the ranch, says Exhibit Technician David Alloway, but improvements are being made. To facilitate university research on geology, wildlife, botany, and archaeology, the park has renovated and expanded a laboratory for graduate students, complete with lodging facilities. Additional lodging, showers, hiking trails, campgrounds, and equestrian and mountain bike trails are planned.
The park is divided into zones where the number of visitors at any given time is strictly controlled. Sensitive areas within the park are monitored to assess the effects of public use, and visitors can be rerouted if necessary to minimize harmful human impacts (TPWD 1994, 21).
The differences noted above stem in large part from the different ways that Big Bend and Big Bend Ranch are financed. The lion’s share of Big Bend’s funding comes from the federal treasury, while Big Bend Ranch depends much more heavily on revenue from fees.
| Table 3 Summary of Comparisons, FY 1995 |
|||
|---|---|---|---|
| Big Bend1 Ranch Complex |
Big Bend National Park |
||
| Acreage | 300,000 | 810,763 | |
| Staff size | 14 | 94 | |
| Visits2 | 56,697 | 314,209 | |
| Operating budget | $ 463,1653 | $3,951,000 | |
| Revenue | $176,0424 | $ 337,103 | |
| Revenue per acre | $ 0.59 | $0.42 | |
| Expenses per acre | $1.54 | $4.87 | |
| 1Includes ranch area, Fort Leaton, and Warnock Barton Environmental Center.
2 Visits include waived per-person entrance fees for children under 12 and adults who have the Texas Conservation Passport. 3 About 67 percent of the operating budget comes from fees collected at all state parks and redistributed throughout the system and 33 percent is derived from a dedicated tax on recreational equipment sales. 4 Revenue originating from complex only. Sources: Data for Big Bend Ranch Complex provided by Luis Armendariz, Superintendent, Big Bend Ranch State Park, in a telephone interview, October 1996. Data for Big Bend National Park provided by Valerie Naylor, Chief of Interpretation and Visitor Services, Big Bend National Park, in a telephone interview, March 1996, and Andrew Teter, Budget Analyst, U.S. Department of Interior, National Park Service, Budget Division, by fax, 11 April 1996. |
|
|
|---|
As Table 3 shows, Big Bend Ranch’s cost-saving incentives and dependence on user fees result in lower expenses and higher returns per acre than Big Bend. Big Bend Ranch earned more per acre although it had far fewer visitors. Also, the state park had much lower operating expenses per acre and a much smaller staff but managed to provide more services (see Table 4).
| Table 4 Services Available , 1995 |
|
|---|---|
| Big Bend Ranch Complex |
Big Bend National Park |
| Museum/historical site tours ($2./$2.50) | Bird watching (free) |
| Bird watching ($3) | River running (free) |
| Rafting, canoeing ($3) | Camping ($5) |
| Camping ($3 per night) | Hiking (free) |
| Wilderness backpacking ($3) | Fishing (free) |
| Hiking ($3) | Nature workshops (free) |
| Fishing | |
| Swimming ($3) | |
| Horseback riding ($3) (horses leased for $50) |
|
| Longhorn cattle drive ($350 each) | |
| Interpretive bus tours ($60) | |
| Weekend Nature seminars ($300/3 days) | |
| Source: Data for Big Bend Ranch Complex provided by Luis Armendariz, Superintendent, Big Bend Ranch State Park, in a telephone interview, October 1996. Data for Big Bend National Park provided by Valerie Naylor, Chief of Interpretation and Visitor Services, Big Bend National Park, in a telephone interview, March 1996, and Andrew Teter, Budget Analyst, U.S. Department of Interior, National Park Service, Budget Division, by fax, 11 April 1996. |
Since general funding support for the operation of Texas’ state parks ended in 1994, the staff at Big Bend Ranch have had a strong incentive to generate more revenues from user fees. They have done this by creating a proliferation of fee-based activities. Since Big Bend Ranch operates under the EBS program, Superintendent Luis Armendariz gets to keep for the park as much as 35 percent of any revenue above his target level that he generates from new services, plus all cost savings he achieves. He spends these revenues as he chooses on the park. This year, his “profit” will buy a new pickup truck, radios to facilitate communication between rangers in the field, repairs for a park road grader, and new dishes and a freezer for the visitor lodge. New camping areas will be opening in the future and will probably increase visitation.
Custer State Park vs. Wind Cave National Park
The prairie lands in the southwest corner of South Dakota contain two parks with a common border: Wind Cave National Park and Custer State Park. The parks share similar features. With rugged mountains surrounded by prairie, the land is populated with bison, pronghorn antelope, deer, coyote, turkey, and prairie dogs. Both parks offer numerous activities including hiking, horseback riding, scenic drives, picnicking, camping, and wildlife viewing. The national park also offers caving. Both are “destination parks,” attracting visitors from distant regions. Other nearby attractions include the Black Hills and Mount Rushmore. Many of the features of the parks are similar, but their administration is not.(18)
Wind Cave National Park
Established in 1903, Wind Cave National Park is not considered a major national park, but it has distinguishing features that attract tourists. The cave has more than 76 miles of passages, reaching as far as 500 feet below the surface. Its walls are covered with distinctive crystal formations unlike the stalactitic and stalagmitic growths found in most other caves. Ranger-guided cave tours are scheduled daily year-round at a cost of $3 to $15, depending on the extent of the tour. (Children under six are free but are not allowed on all cave tours; persons aged six to fifteen or persons holding a Golden Age Passport receive a 50 percent discount on tours.) Ranger-led hikes across the park’s surface lands depart daily in the summer, free of charge.
Although the cave is an important asset, only one-sixth of the park visitors actually tour the cave. There is much more to the park. Its 28,000-plus acres include the cave and grasslands, pine forests, hills and ravines. In 1912, a game preserve was created to reintroduce many species previously eliminated by uncontrolled hunting. Originally, the preserve contained fourteen bison, along with elk, deer, antelope and prairie dogs. The bison herd has since grown to several hundred animals. Much of the wildlife can be observed from the road, but thirty miles of trails weave through the park’s rolling prairie grasslands, ponderosa pine forests and riparian habitat. Fencing encloses the preserve, preventing most of the animals from migrating out of the park.
Wind Cave Park has a bison-carrying capacity of about three hundred animals. To keep the bison at this level, the park removes about sixty-five bison each year. They are sold to Native American tribes at an average price of $275 per head, just enough to cover the costs of roundup and sale. Elk are managed in a similar manner every three to five years. Hunting is not allowed.
The park offers no lodging, gas or groceries. Only one developed campground is available, for a fee of $10 per night during peak season, $5 during the shoulder season. There is no entrance fee into the national park and no other user fees are charged.
Custer State Park
Located directly north of Wind Cave, Custer State Park was established in 1919 to preserve wildlife, open prairie, granite spires, and pristine lakes. The park, which extends 73,000 acres, is about two-and-a-half times the size of Wind Cave. It also has abundant wildlife, including one of the world’s largest bison herds, plus bighorn sheep, mountain goats, elk and burros. Like Wind Cave, the southern end of the park has rolling hills, grasslands and pine forests. The northern end, higher in elevation, has granite spires and spruce forests. Mountain streams run across the park, flowing into pristine lakes.
Activities abound at Custer. Some are free of charge (except for the entrance fee). These include fishing, climbing, swimming, boating, mountain biking, and wildlife viewing. (Custer has more water than Wind Cave, so there are more water-based activities.) Fees are charged for horseback riding, hayrides, pack trips, “Buffalo Safari Jeep Rides” to the park interior, chuck wagon dinners and theater performances (Custer State Park 1996). The park offers a full range of accommodations, from rustic to deluxe, in its four developed resorts, which have dining, lounges and general stores. The park hosts 321 campsites, from primitive to full-service, at a cost ranging from $2 per person per night to $12 per site per night. An entrance fee of $3 per person ($2 during the winter months) or $8 per vehicle ($5 in the off-season) is charged. An annual license can be purchased for $20 per vehicle.
Custer State Park generates substantial revenues through its animal management program. The park range has a winter carrying capacity of 950 bison. Spring calving increases the herd to nearly 1,500 head, so each fall Custer has a roundup and buffalo auction. The roundup has become a festive affair, attracting several thousand bystanders to watch Bob Landis and other local volunteers on horseback herd together the more than one thousand bison. In fiscal year 1996, the auction generated more than $800,000, at a cost of $135,000. Prices of the bison varied. One bull was sold for $8,000; a more typical price per animal was $2,200.
The park also has a limited hunting season for game animals, including elk, bison, bighorn sheep, and wild turkey. Hunting licenses earn money for the park and keep the number of animals within the park’s carrying capacity. Game licenses brought in over $100,000 in 1996, at a cost of $35,000 for one full-time employee.
Because of its large acreage, Custer State Park has been allotted its own division under the South Dakota Department of Game, Fish and Parks. All park revenues go into a revolving fund held specifically for Custer. Annually, the park creates a budget plan under which it must operate. Funds are returned to the park via legislative appropriation but generally the park receives the amount requested and any funds not used are maintained in the fund, with interest, for Custer. The park is self-supporting in its day-to-day operations, but receives some tax dollars for maintenance.
In 1989, the park needed $7.8 million for rehabilitation and development. To foot that bill, the park renegotiated with concessionaires, increasing the franchise fee to 18 percent of gross proceeds. The first $100,000 of the fee goes to the Custer State Park fund for operating expenses; 3 percent of the fee is used for maintenance, to be appropriated by the Game, Fish and Parks Commission; and the remainder repays the state revenue bonds that were issued to complete the project. A 3 percent tax on all goods and services sold in the park helps finance marketing and promotion. These promotional efforts have increased visitation, filling campgrounds during peak periods, compared to only 40 to 50 percent of capacity previously.
| Table 5 Summary of Comparisons, FY 1995 |
|||
|---|---|---|---|
| Custer State Park |
Wind Cave National Park |
||
| Acreage | 73,000 | 28,292 | |
| Staff size | 51 | 37 | |
| Visits | 1,600,000 | 1,094,933 | |
| Operating budget | $ 3,019,922 | $1,212,000 | |
| Fees | $ 2,500,000 | $ 389,735 | |
| Total revenue | $ 3,607,500 | $ 389,735 | |
| Revenue per acre | $ 49.42 | $ 13.78 | |
| Expenses per acre | $ 41.37 | $ 42.84 | |
| Sources: State park data provided by Craig Pugsley, Supervisor of Visitor Services, Custer State Park, in telephone interviews, July and November 1996; Roger Bamsey, Business Manager, Custer State Park, fax dated April 1996; and a Custer State Park Resort Company publication, 1996 Lodging Rates and Information. Data for Wind Cave National Park provided in a letter from Paul Menard, Chief of Administration, Wind Cave National Park, dated 12 August 1996; and from the park’s annual publication, |
In sum, Custer State Park is much more entrepreneurial than Wind Cave National Park when it comes to generating revenue. As Table 5 indicates, in fiscal year 1995 Custer collected $566,125 more than its operating budget of $3.02 million. Part of this surplus was invested in wastewater treatment. Custer also appears to be run more efficiently. It spent slightly less per acre operating the park than did Wind Cave, but provided more customer services and more park management activities.
While Custer earns a surplus, Wind Cave loses money–nearly $.75 for every visitor. Its budget is much smaller than Custer’s, only $1.2 million, and revenues are less than $400,000. Like other national parks, Wind Cave has little incentive to generate revenues.
Back to the Future for Our Parks
Only by making those who run our parks financially accountable to users can we spur effective management and stable funding for our parks. Toward that end, we recommend several policy changes. If enacted, they would unleash entrepreneurial abilities, increase revenues, save money, and enable park managers to refurbish visitor facilities and protect natural resources.
- Congress and state legislatures should establish a fixed schedule that gradually reduces annual appropriations for park operations over a ten-year period until they reach zero.
- Congress and state legislatures should allow park managers to institute their own fee programs.
- Most of the fees collected in these parks, about 95 percent, should remain in the park in which they were collected, to be used to fund operations there. A small amount, perhaps 5 percent, could be used to fund systemwide administration. Any revenues in excess of costs should be retained by the parks.
- Park managers should have the authority to raise fees or establish new fee-based services as demand dictates, without having to obtain approval from Congress or state legislatures.
- Each park should have a special “park endowment fund” for capital improvements and repairs. The fund would be allowed to invest in financial assets such as high-quality stock-and-bond funds and treasury bills. A percentage of concessionaire sales as well as park road tolls should also contribute to the fund (Anderson and Liffmann 1996). Interest from the fund should be used for annual repair and renovation to buildings and roads.
- Initial investments in the fund could be raised through a variety of private contractual arrangements such as corporate sponsorship of individual parks. Sponsors could pay for exclusive rights to sell or advertise their products in the park for a limited time as long as doing so did not detract from park amenities.
- As an interim step, park managers should be allowed to keep all cost savings and apply them to the budgets for subsequent years. These funds would be treated as budget enhancements, not offsets to subsequent funding.
- To curb incentives for bureaucratic growth in the long term, private competitive bids should be sought for park support functions such as security, fee collection, trash and campground cleanup, and interpretation tours. If these bids indicate that the private sector can provide these services at a much lower cost, then these functions should be provided by contract by the private sector. Government support staff would, in turn, be reduced.
Some parks will not attract enough visitors or have enough other commercially valued assets to be self-supporting. If these parks are to remain public, they should be funded separately out of general funds. Another option is to turn them over to private, nonprofit groups, with a one-time endowment fund for maintenance.
Other parks that may not attract many visitors or that require some seclusion from the public to protect environmental assets may have commercially valued assets such as oil and gas deposits. In these cases, management by a quasi-independent “park endowment board” would be appropriate (Stroup 1990).
Requiring popular parks to be self-sustaining is the surest way of spurring responsible management and financial stability. This is, after all, what Stephen Mather and other early park supporters had in mind near the turn of the century when we were a much poorer nation than we are today. Surely, with our higher incomes today, we as users can afford to pay for these amenities and help make our parks the treasures they should be.
Download the full report, including endnotes and references.